Beautiful, interactive visualizations at your fingertips
Create stunning, interactive charts from your data without writing code.
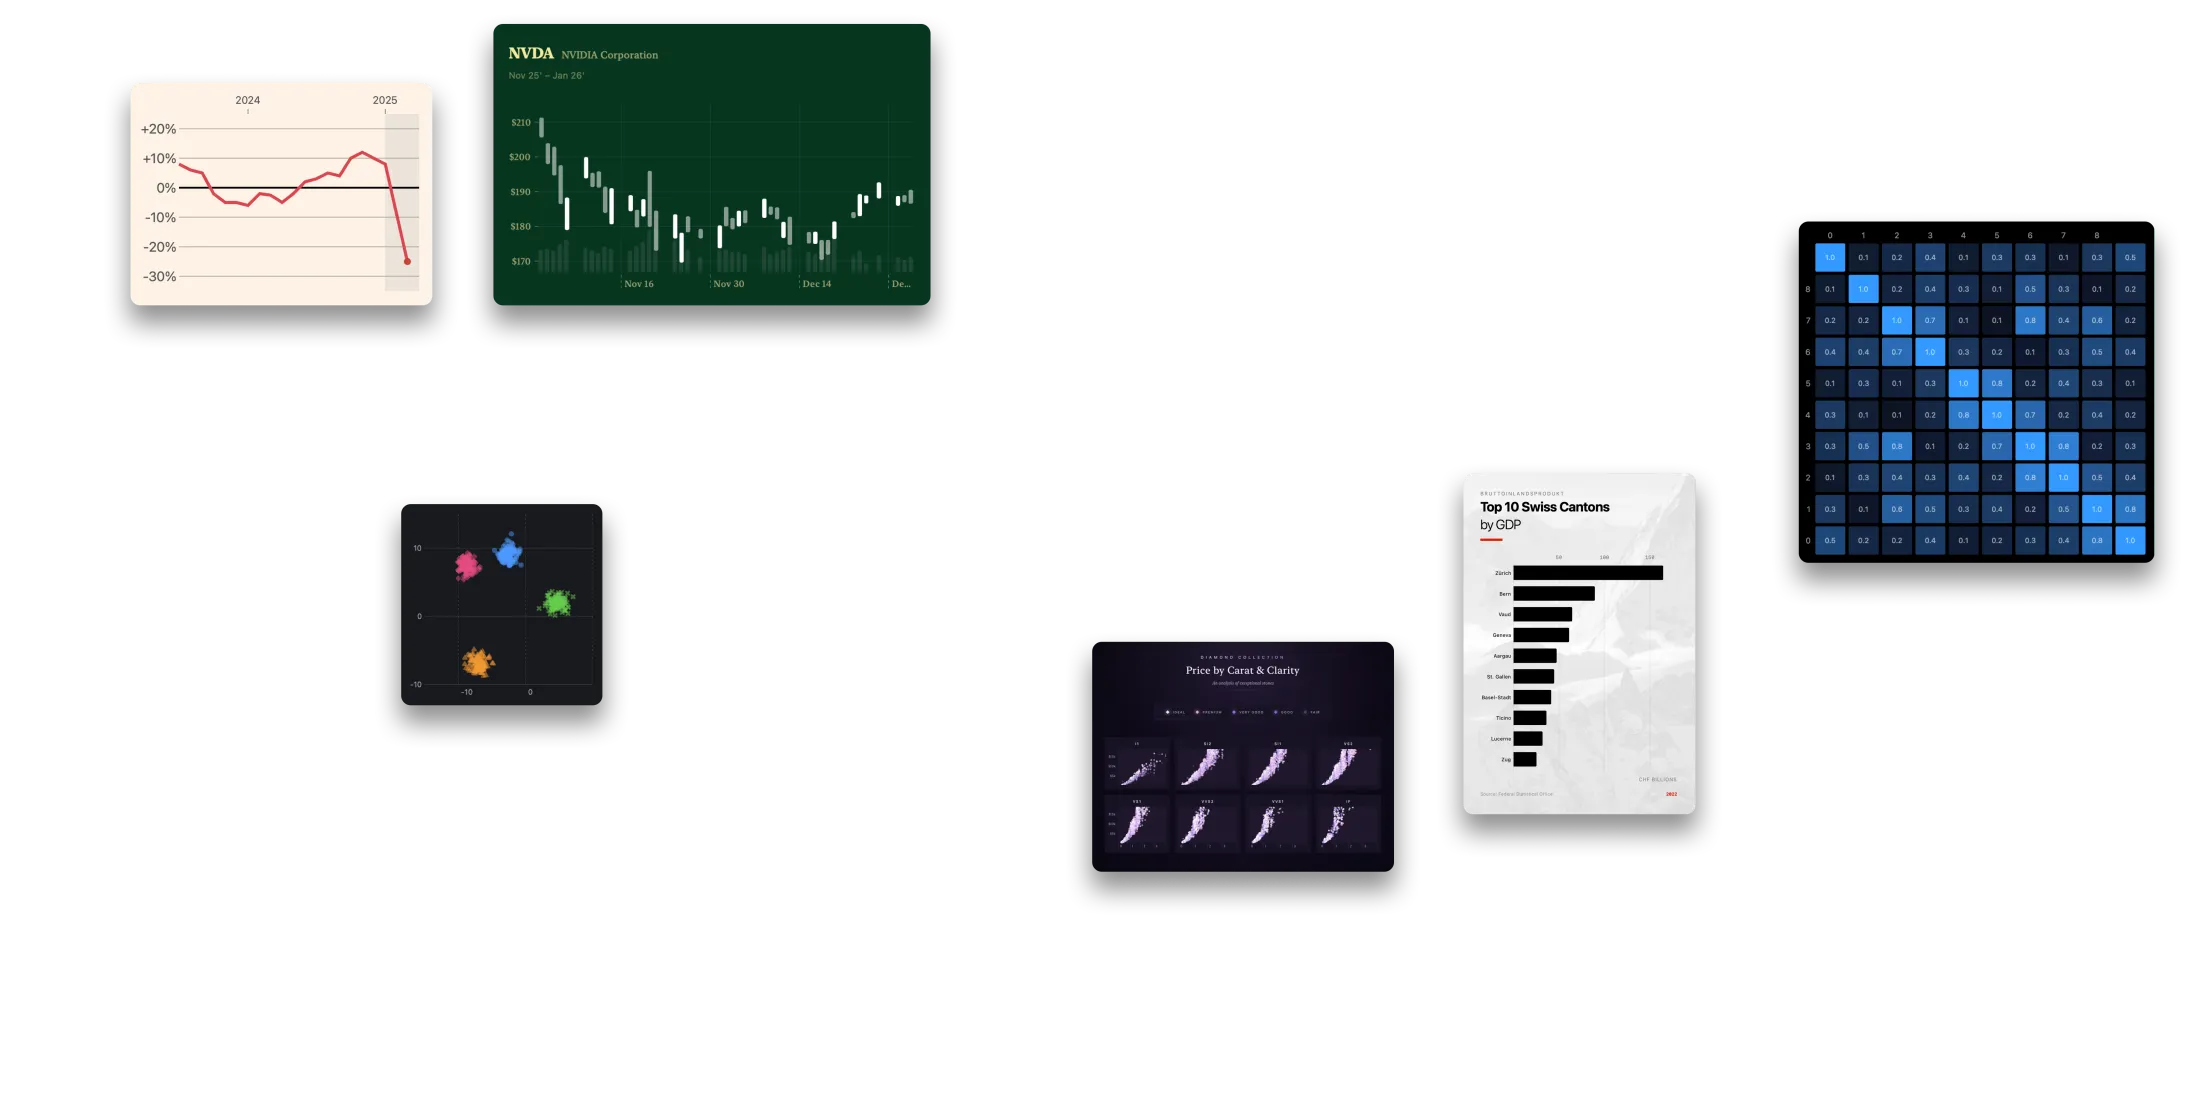
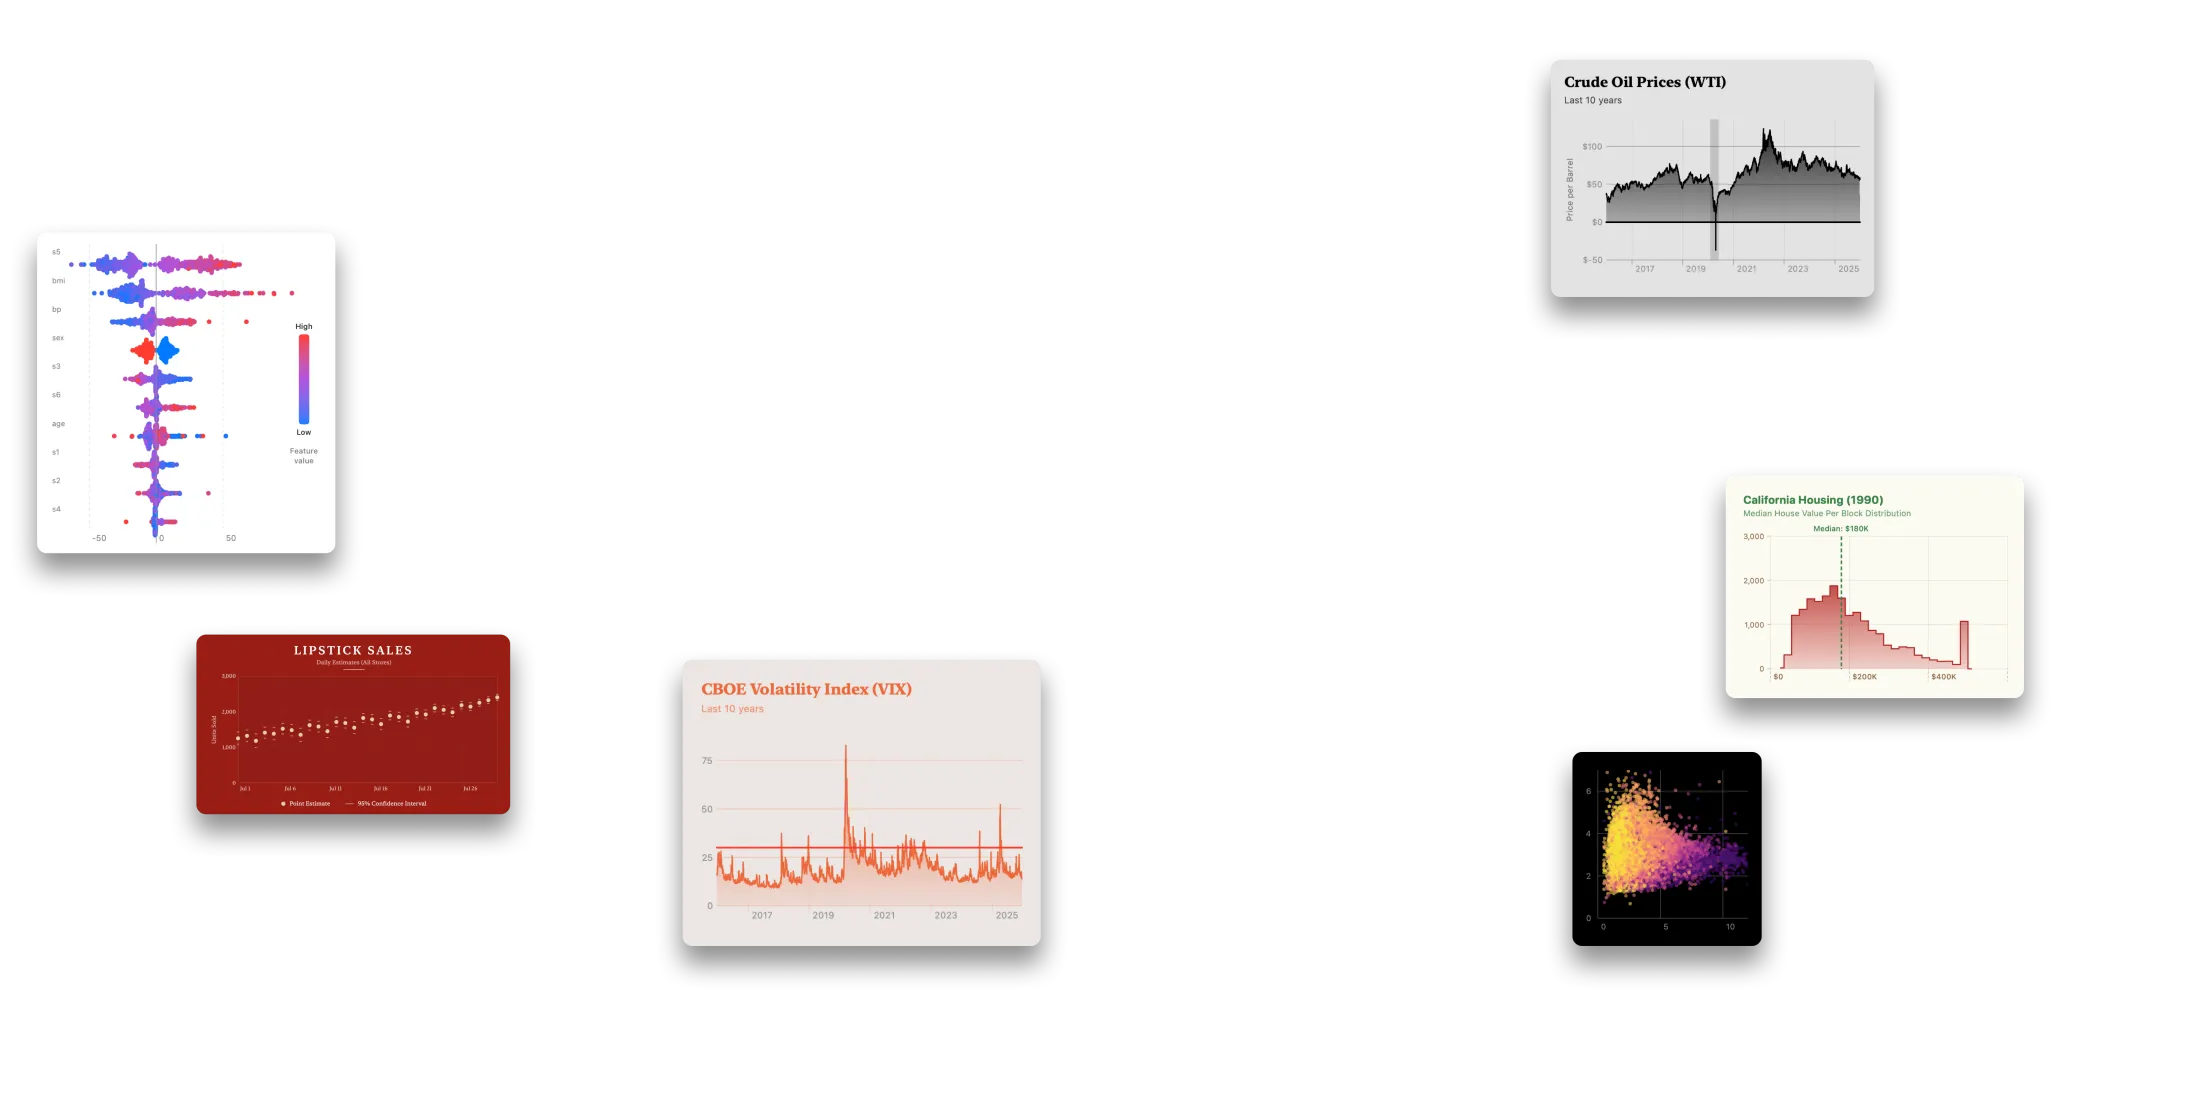
Interactive chart authoring
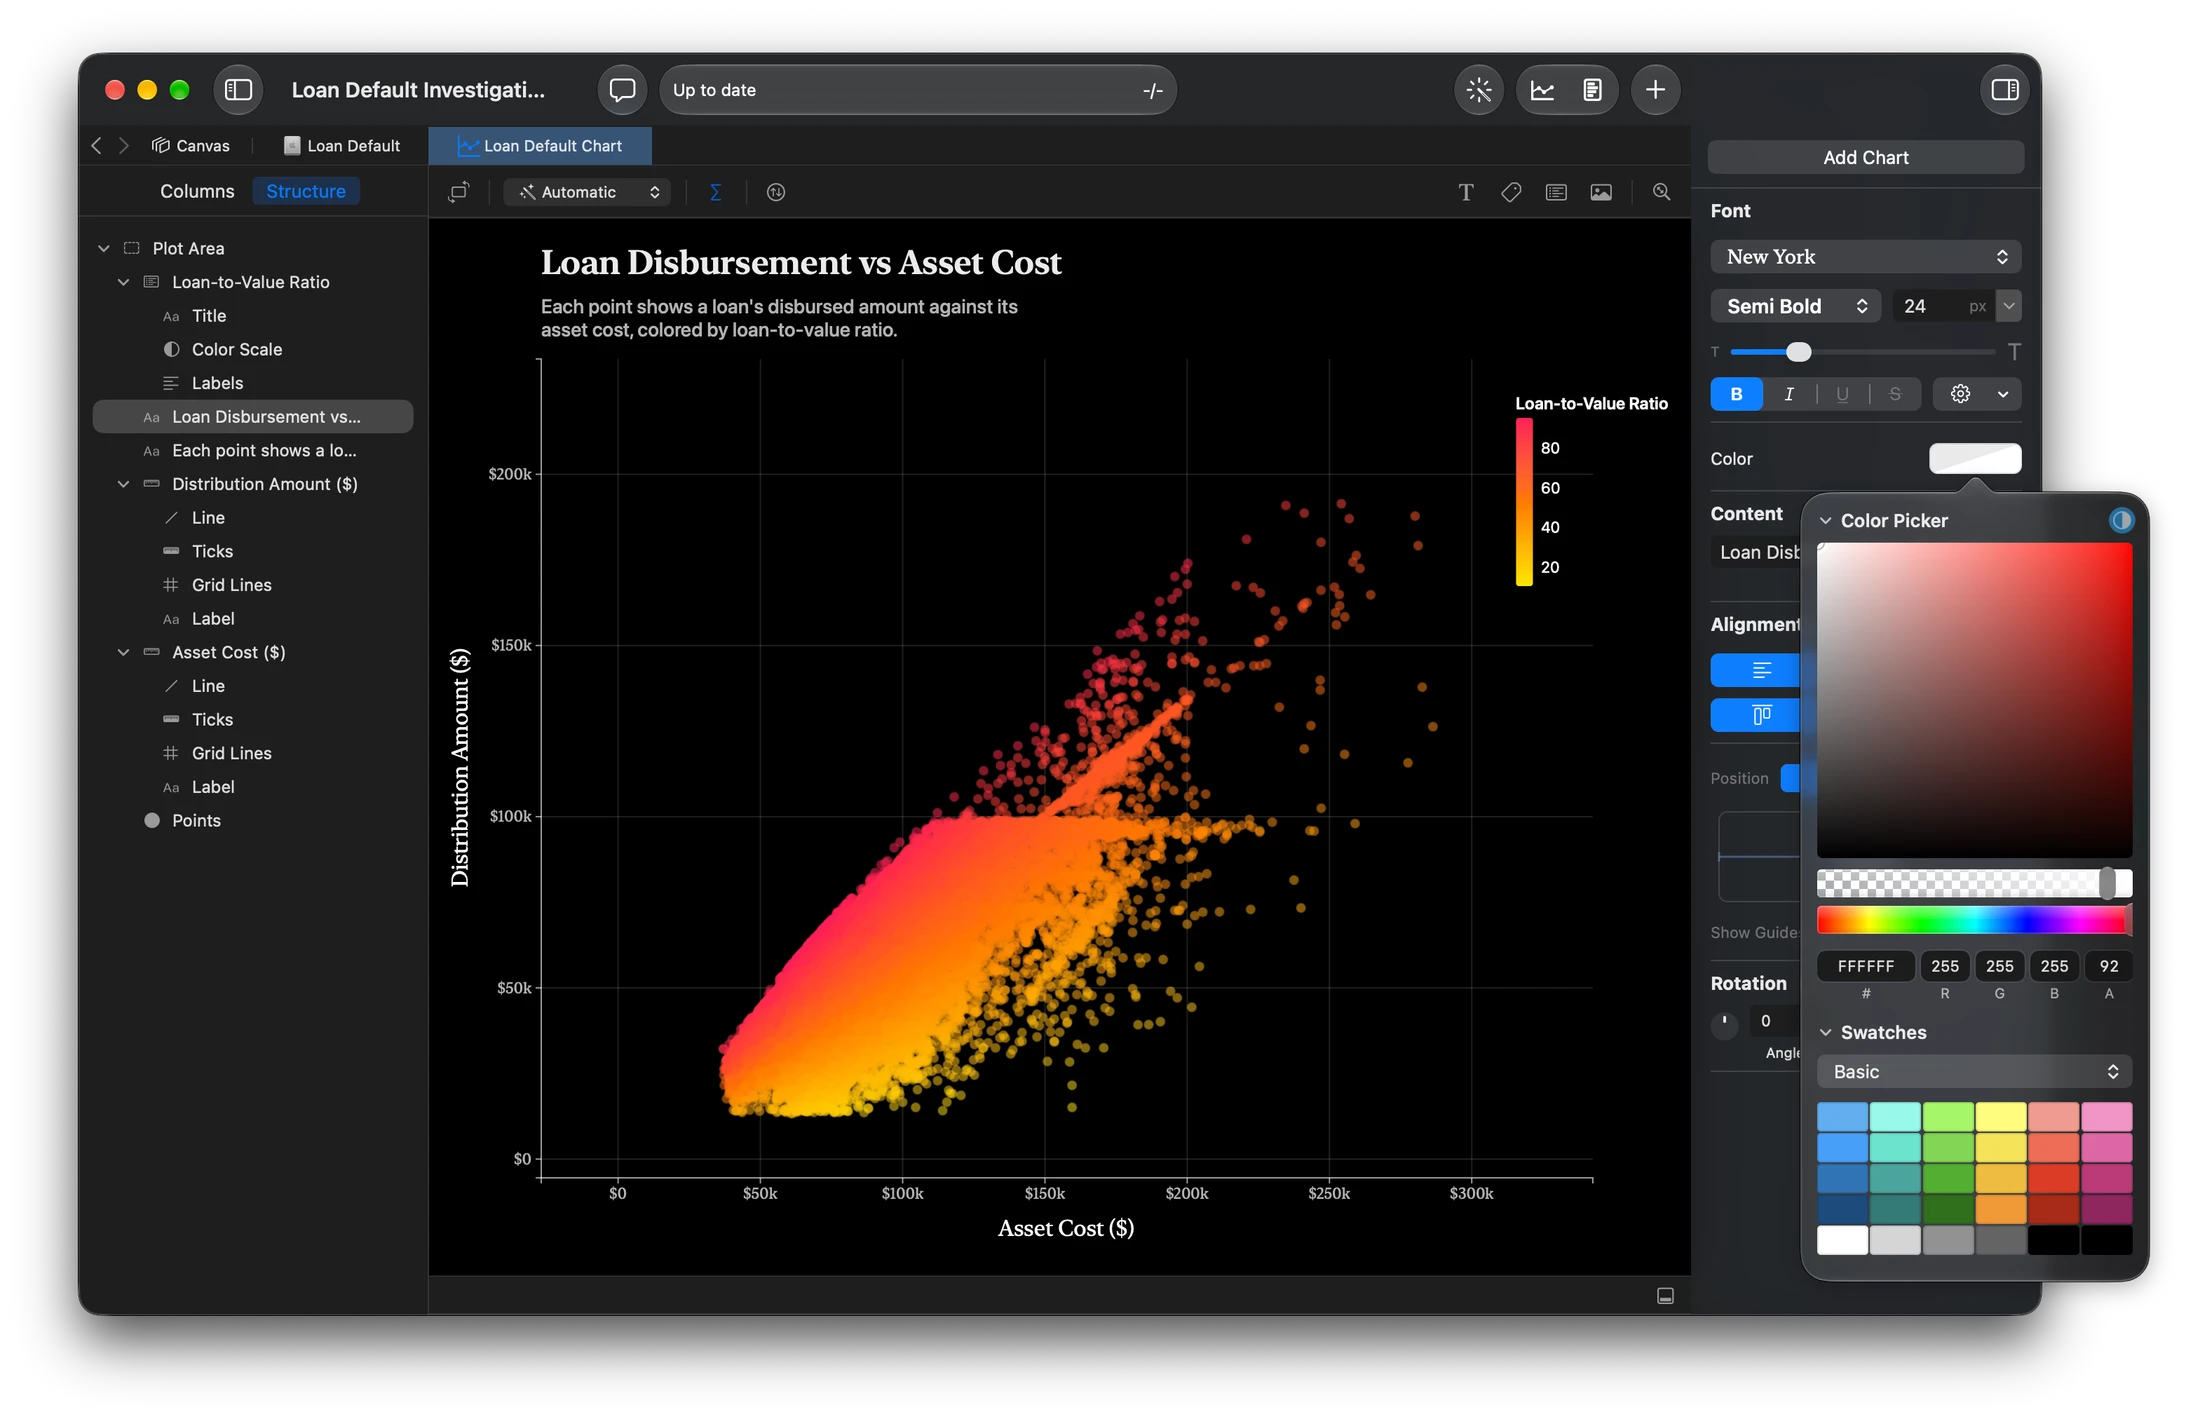
Use a familiar BI-style interface to compose charts, and a Figma-like editing interface to modify them
Drag and drop creation
Easily drag columns onto axes, or existing data points to create, and modify your chart.
Edit like Figma
Each chart has a dedicated structure view that allows your to move, or modify elements.
Annotate with ease
Create custom annotations anywhere on the chart. They're fully customizable, and they resize with the rest of the chart to stay in sync.

Edit with natural language
Using Conversational Intelligence, you can ask Coco to do quick batches of changes without manually implementing them yourself.
Always on brand
Designed to fit your company's brand and style
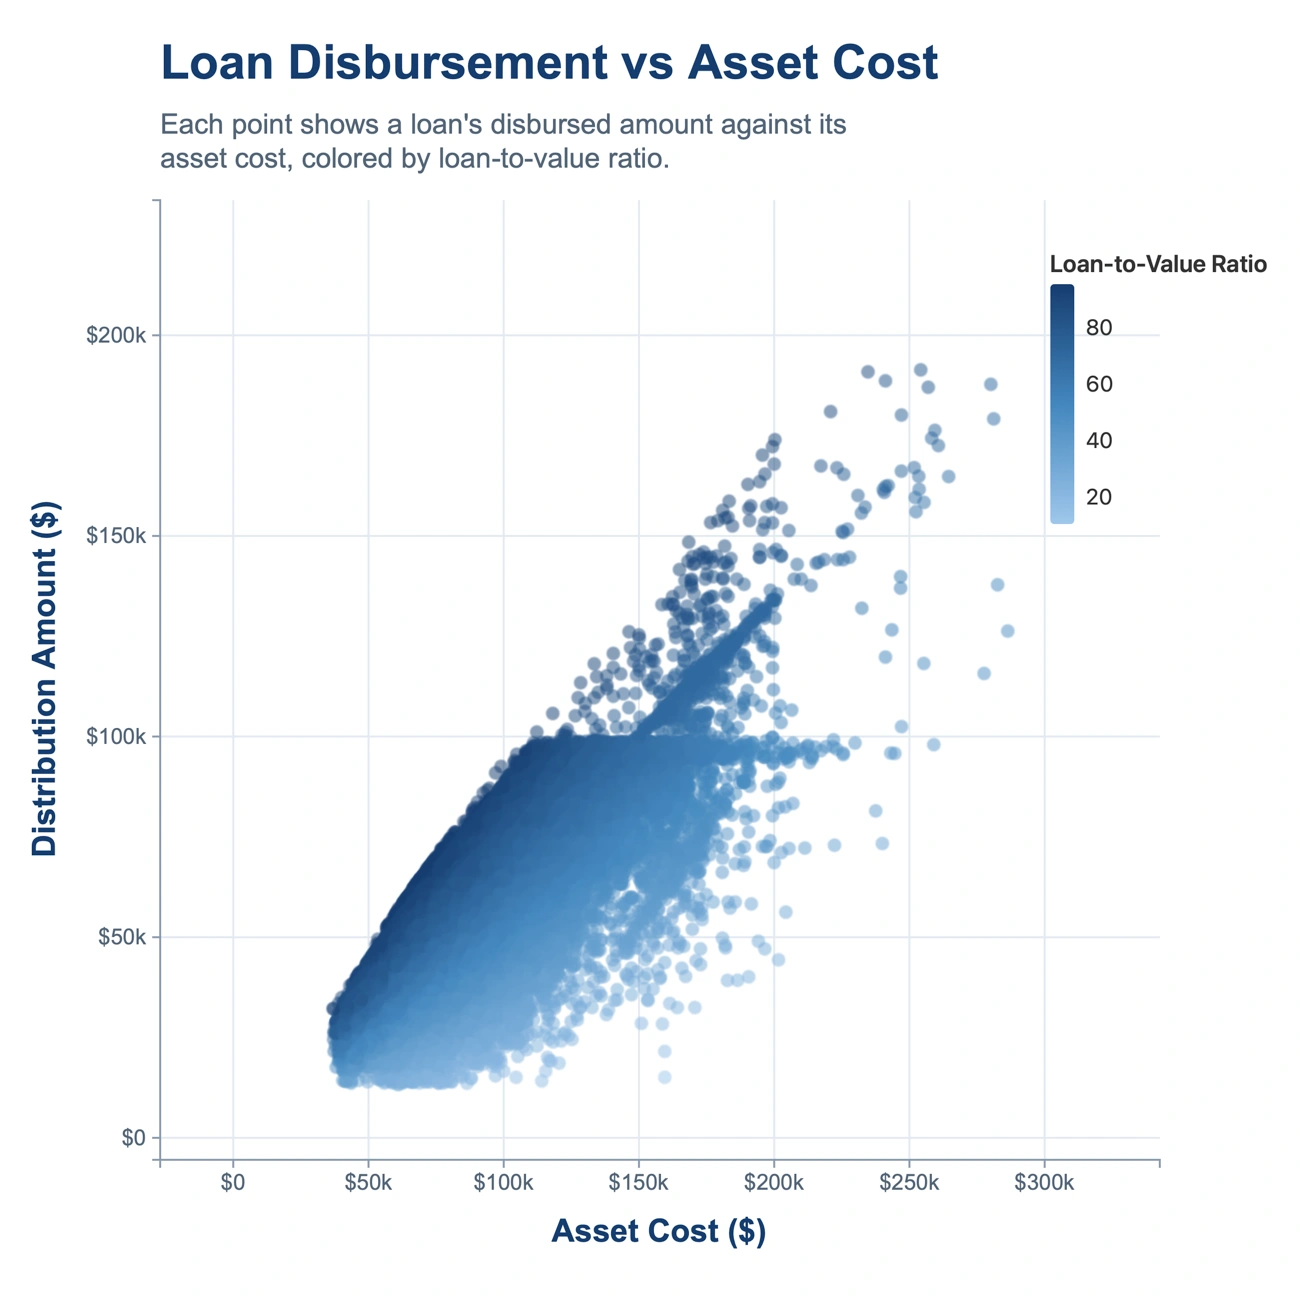
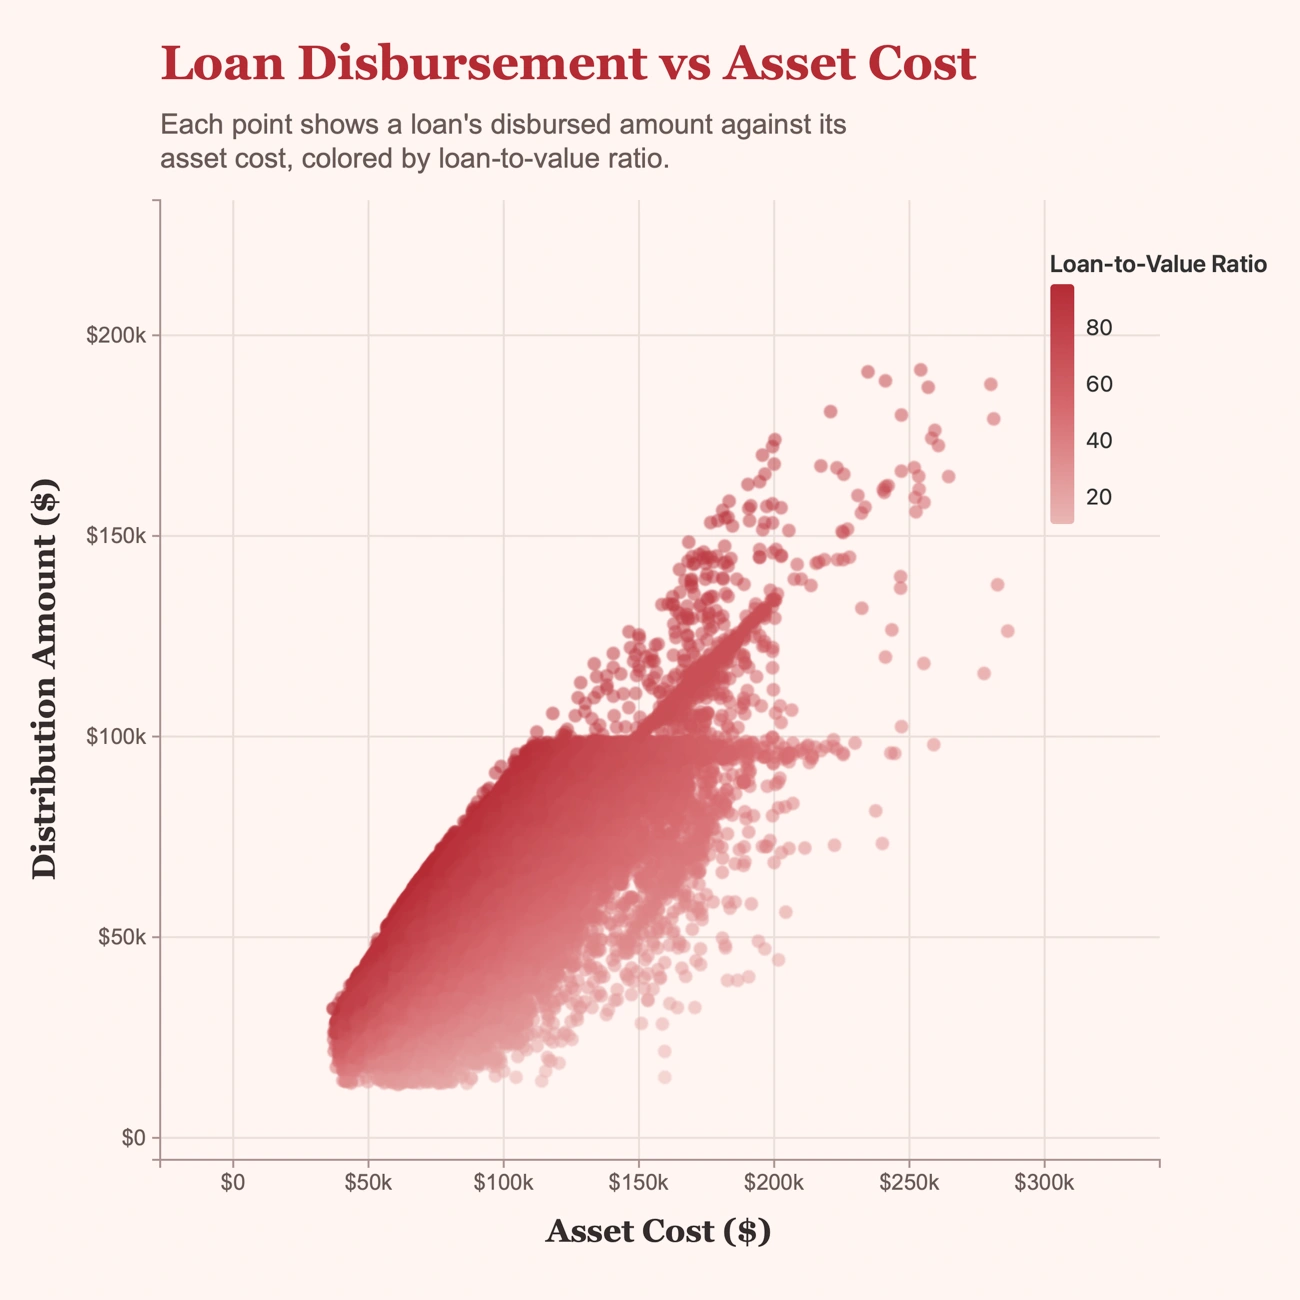
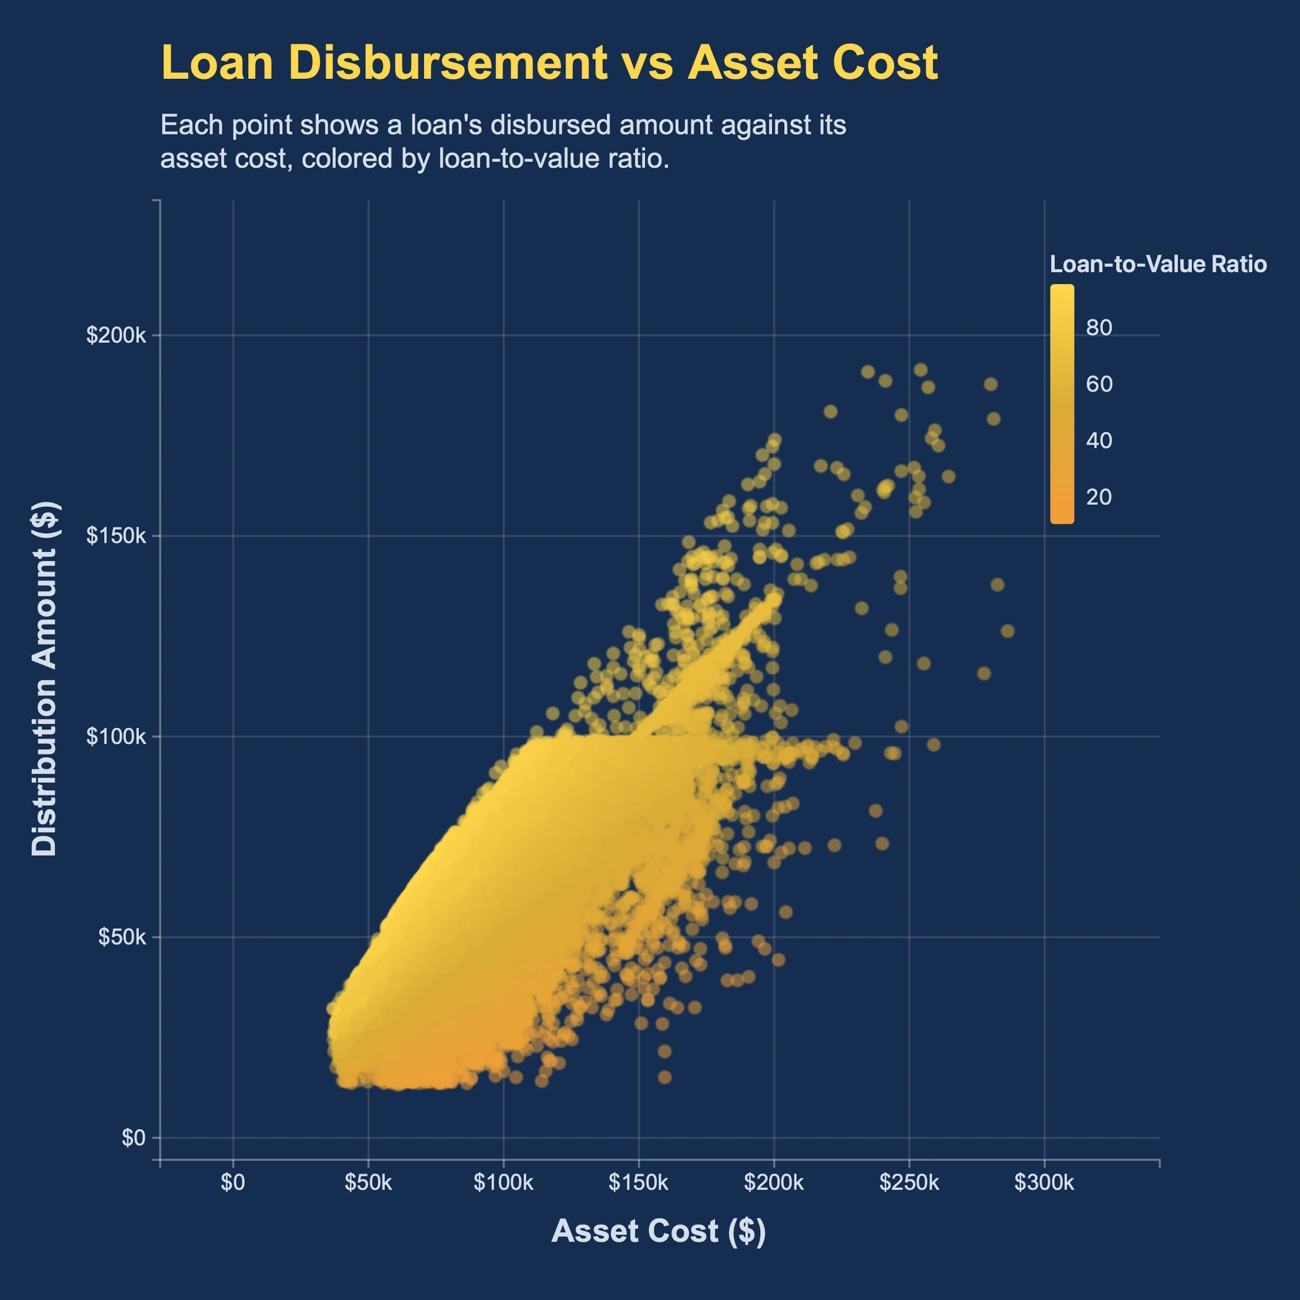

Customizable Colors
Customize any item with the color of your choosing, including gradients.


Extensive Fonts
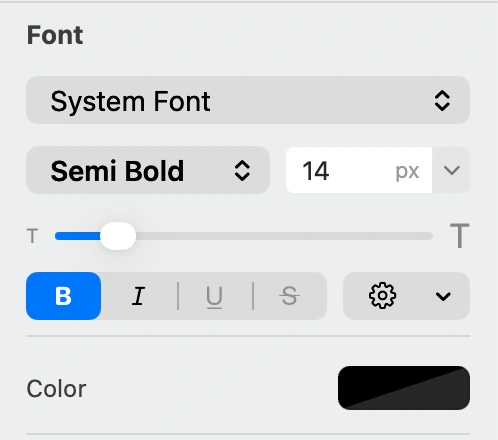
Choose from an extensive set of Fonts, and update any text element on the chart.


Flexible Layout
Freely move elements around the chart canvas, without being constrained by rigid templates.


Embeddable Images
Easily embed your brand's logo, reference images, or backgrounds within your charts.