Coco Alemana is now available
After many months of refinement, optimization and customer discovery, Coco Alemana is finally ready. Our goal is to build the most integrated data tool of all time — merging several parts of your workflow into one continuous flow.
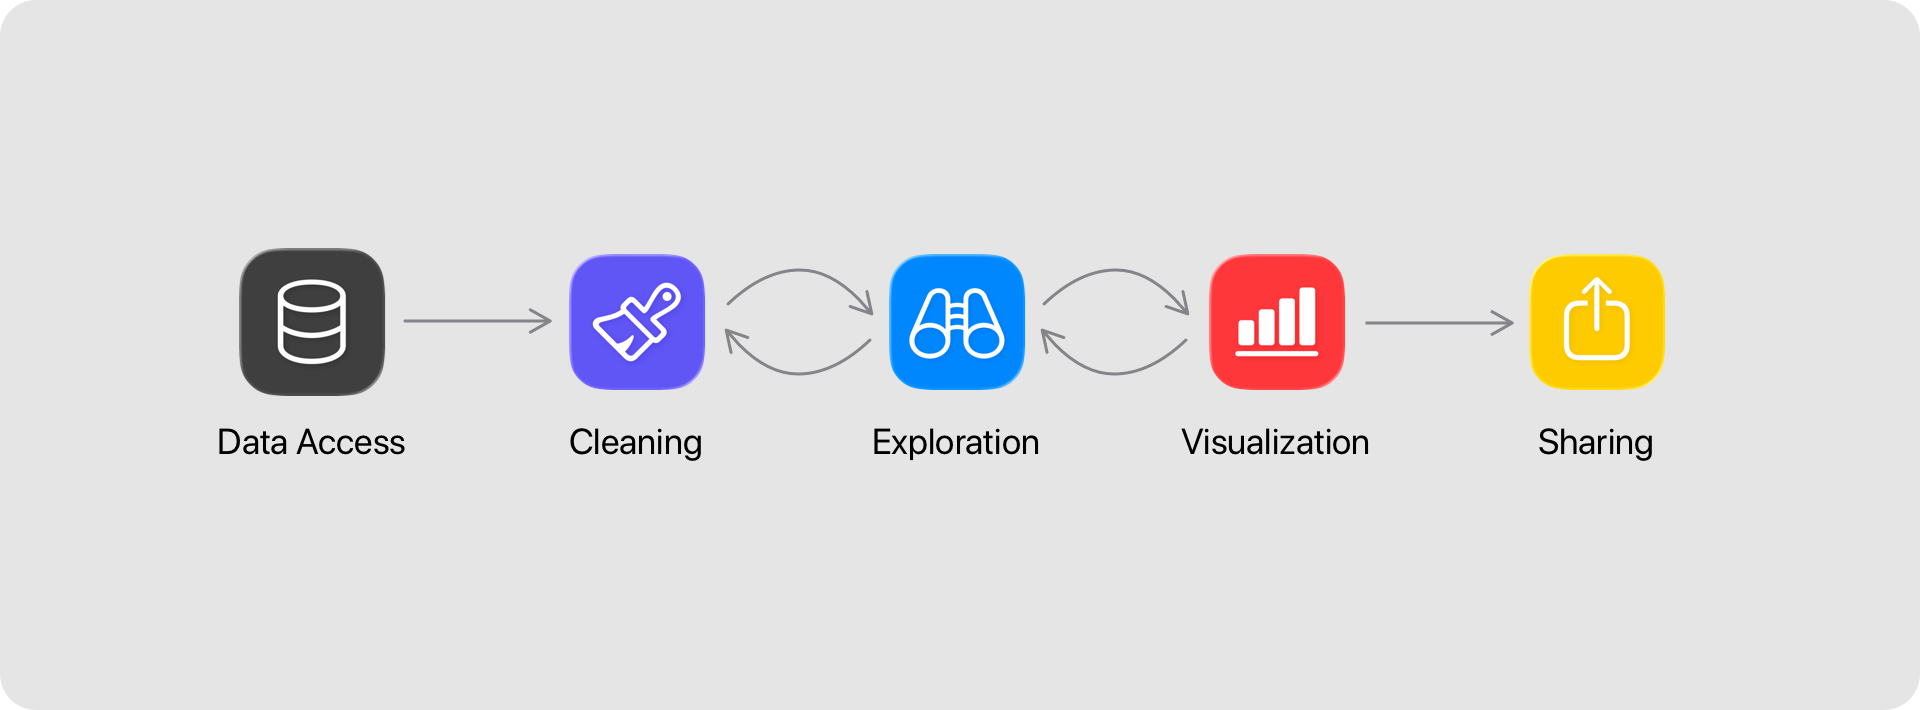
All with the goal of making so many of your day-to-day, tedious tasks disappear through fantastic engineering & design. Throughout this article, I’ll walk through each stage of that workflow, the pain it causes today, and what you’re able to accomplish in Coco instead.
Whether you’re a Data Scientist, Analyst, Researcher, Data Engineer, or jack of all trades — this is for you.
Data Access
When starting any analysis, the first challenge is always loading or accessing your data. Data is also often spread across S3 buckets, local storage, databases, or in that one XLSX file that your company maintains like a god file.
In Python, you have to find the file or database connection, install and import all of the dependencies, and write a bunch of boilerplate just to see 5-10 rows of data. If your data has an error, you spend time and mental effort writing workarounds. Every operation from there on out is manual, and non-interactive.
In legacy apps like Tableau, or PowerBI, you’re limited to slow database connections or a simple CSV. No modern formats like Parquet, Arrow, or connectivity to S3.
Coco makes none of those tradeoffs, and makes it incredibly easy to find your data as well.
Open files quickly
Coco comes with a built-in index that automatically updates when data is moved, changes name, etc. It searches across your connected databases and filesystem. You can activate it by hitting Cmd-Shift-O on your keyboard for quick access.
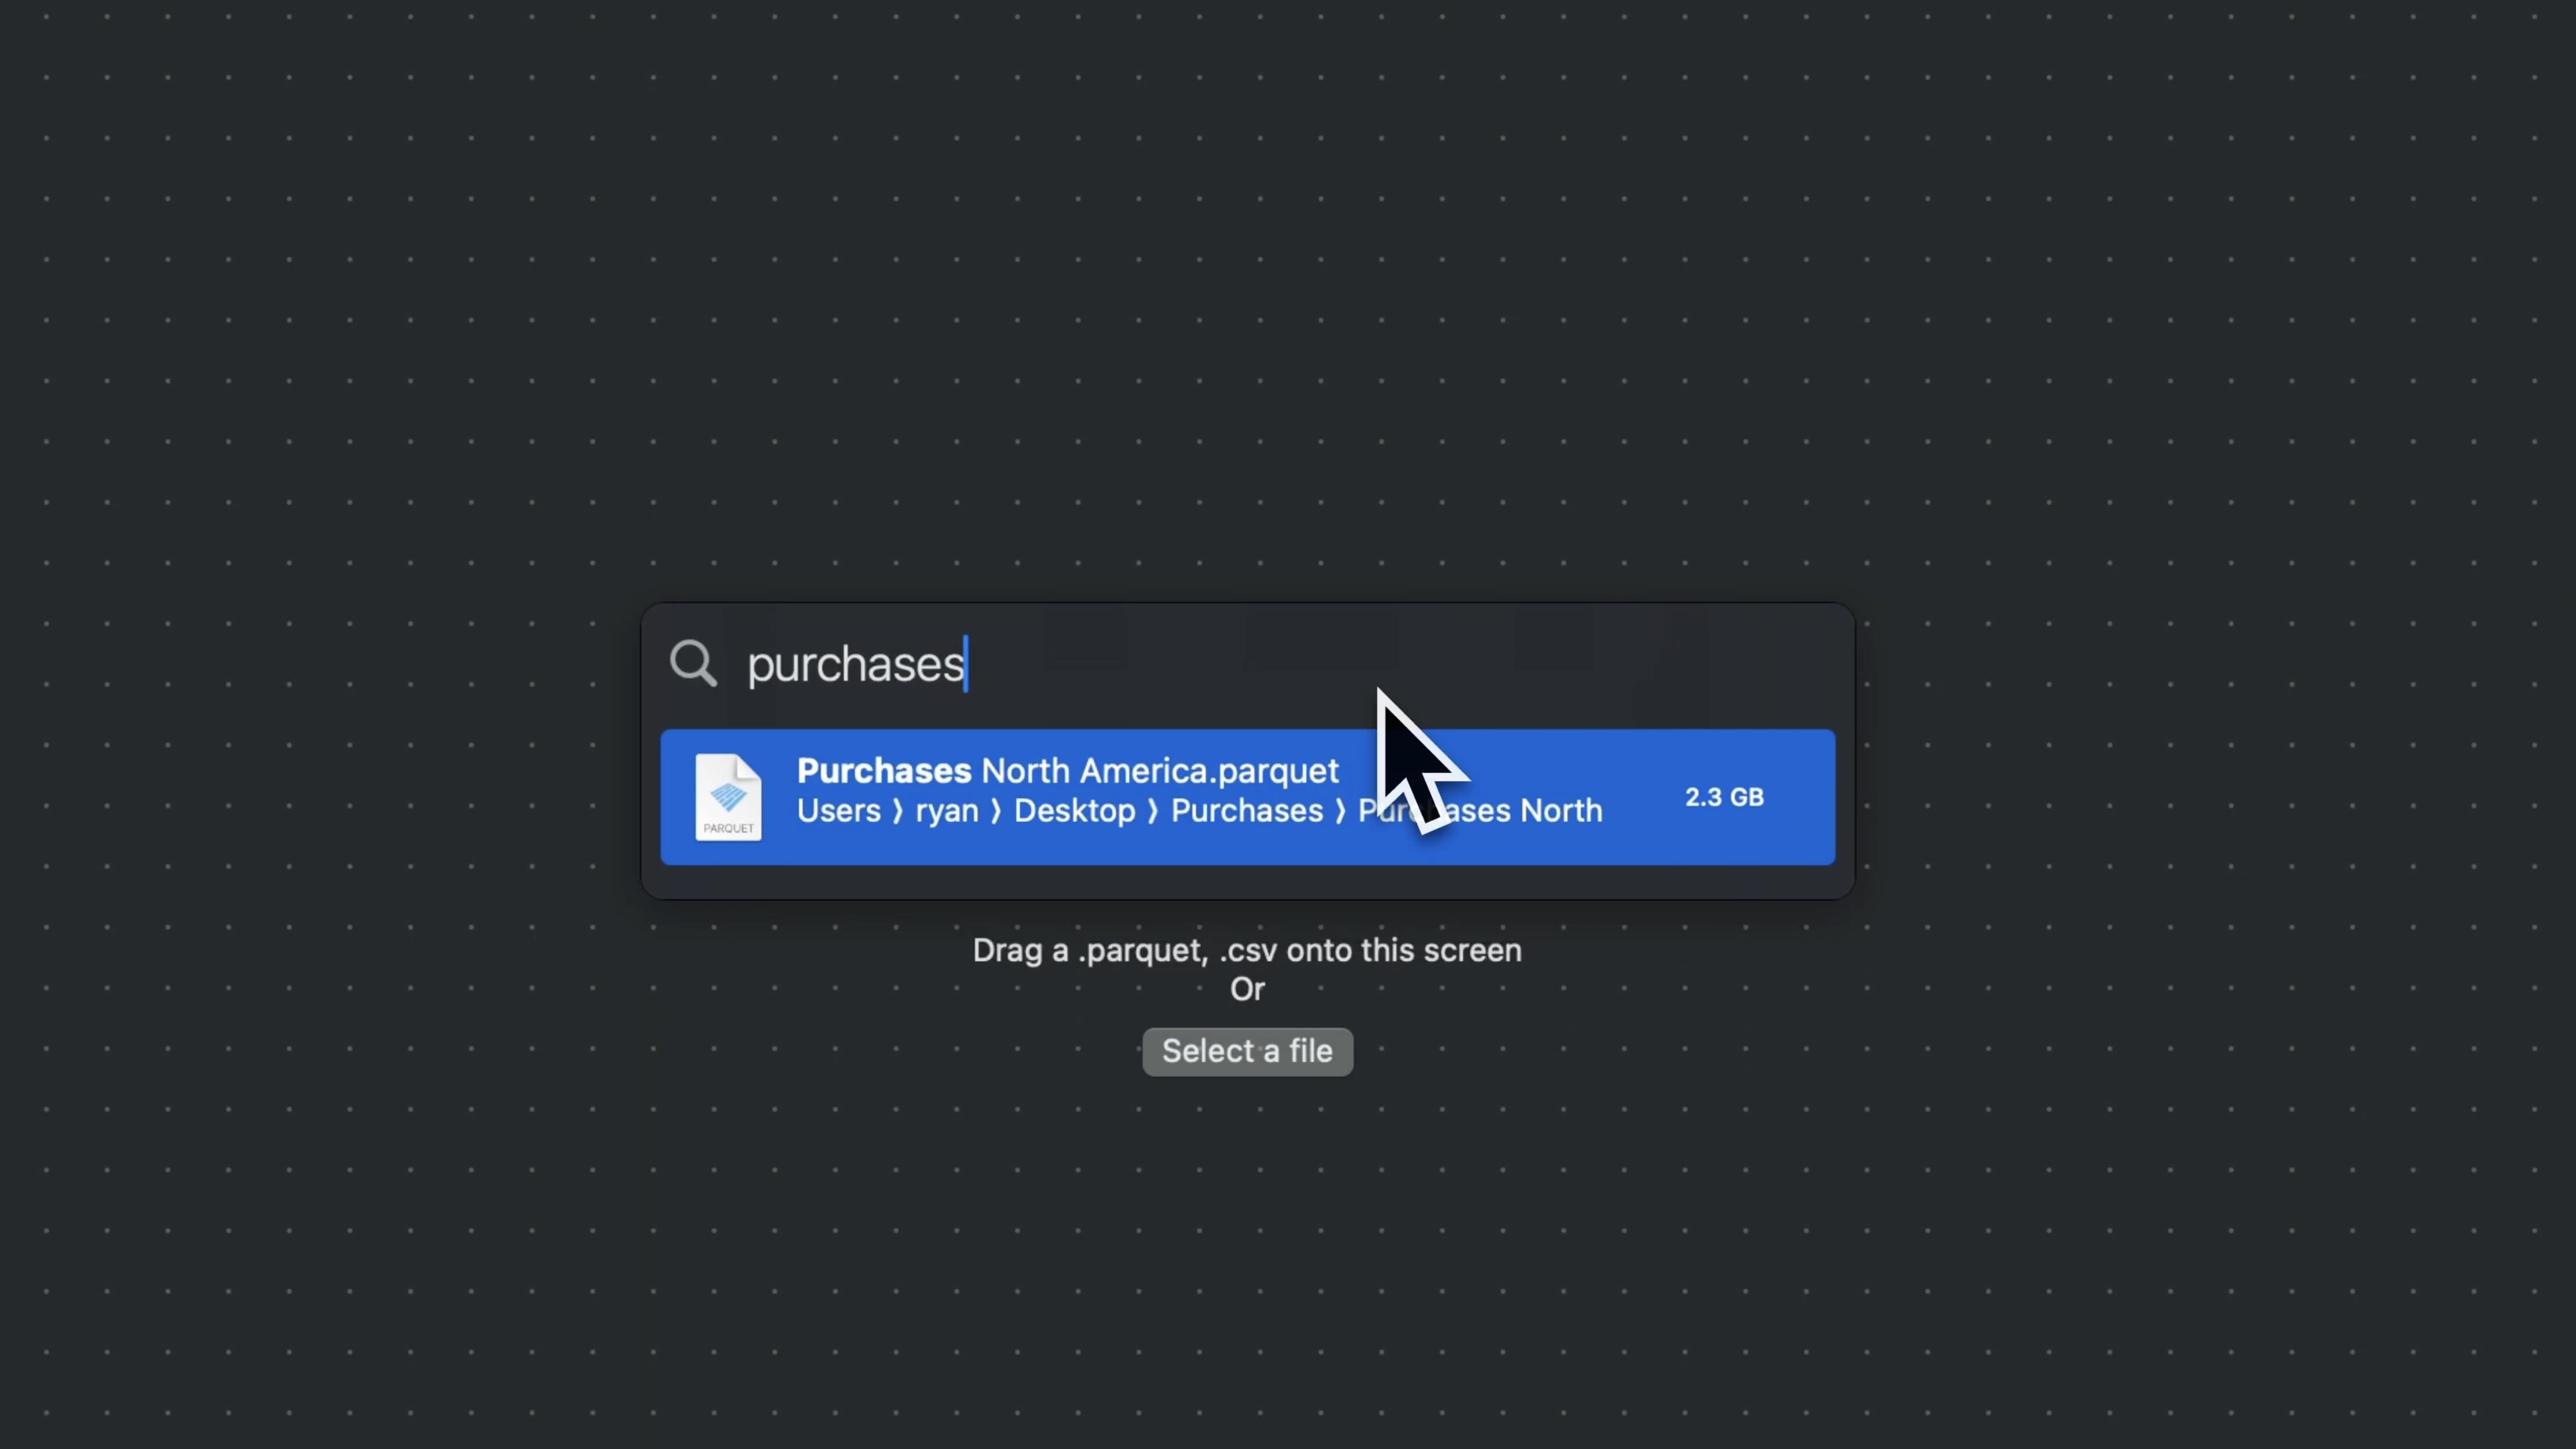
Support for S3
It’s increasingly common for data to be stored entirely on S3, with teams downloading files when needed. Most tools do not make accessing this data easy at all — requiring dedicated extensions or manual downloading from the Console.
Coco comes with built-in support for S3 connected directly to Finder, making S3 a first-class citizen. Once enabled, you’re able to browse all of your S3 buckets as if they were just another folder on your Mac. Compatible files like Parquet, Arrow, and JSONL all open in Coco Alemana. For other file types, like images or text files, they open in whatever default application is configured.
To learn more, see our S3 integration guide.
Cleaning
Ensuring your data is clean is the #1 most important task before any analysis or visualization takes place. As the saying goes: Garbage In, Garbage Out.
In Python, cleaning means a long chain of pandas operations, re-running cells, and squinting at the output to check whether the fix actually worked. Errors hide until they blow up three steps later. In legacy BI tools, transforms are limited enough that most people give up and push the real cleaning back into SQL or a script anyway.
Coco makes identifying problems and solving them as easy as possible.
See errors instantly
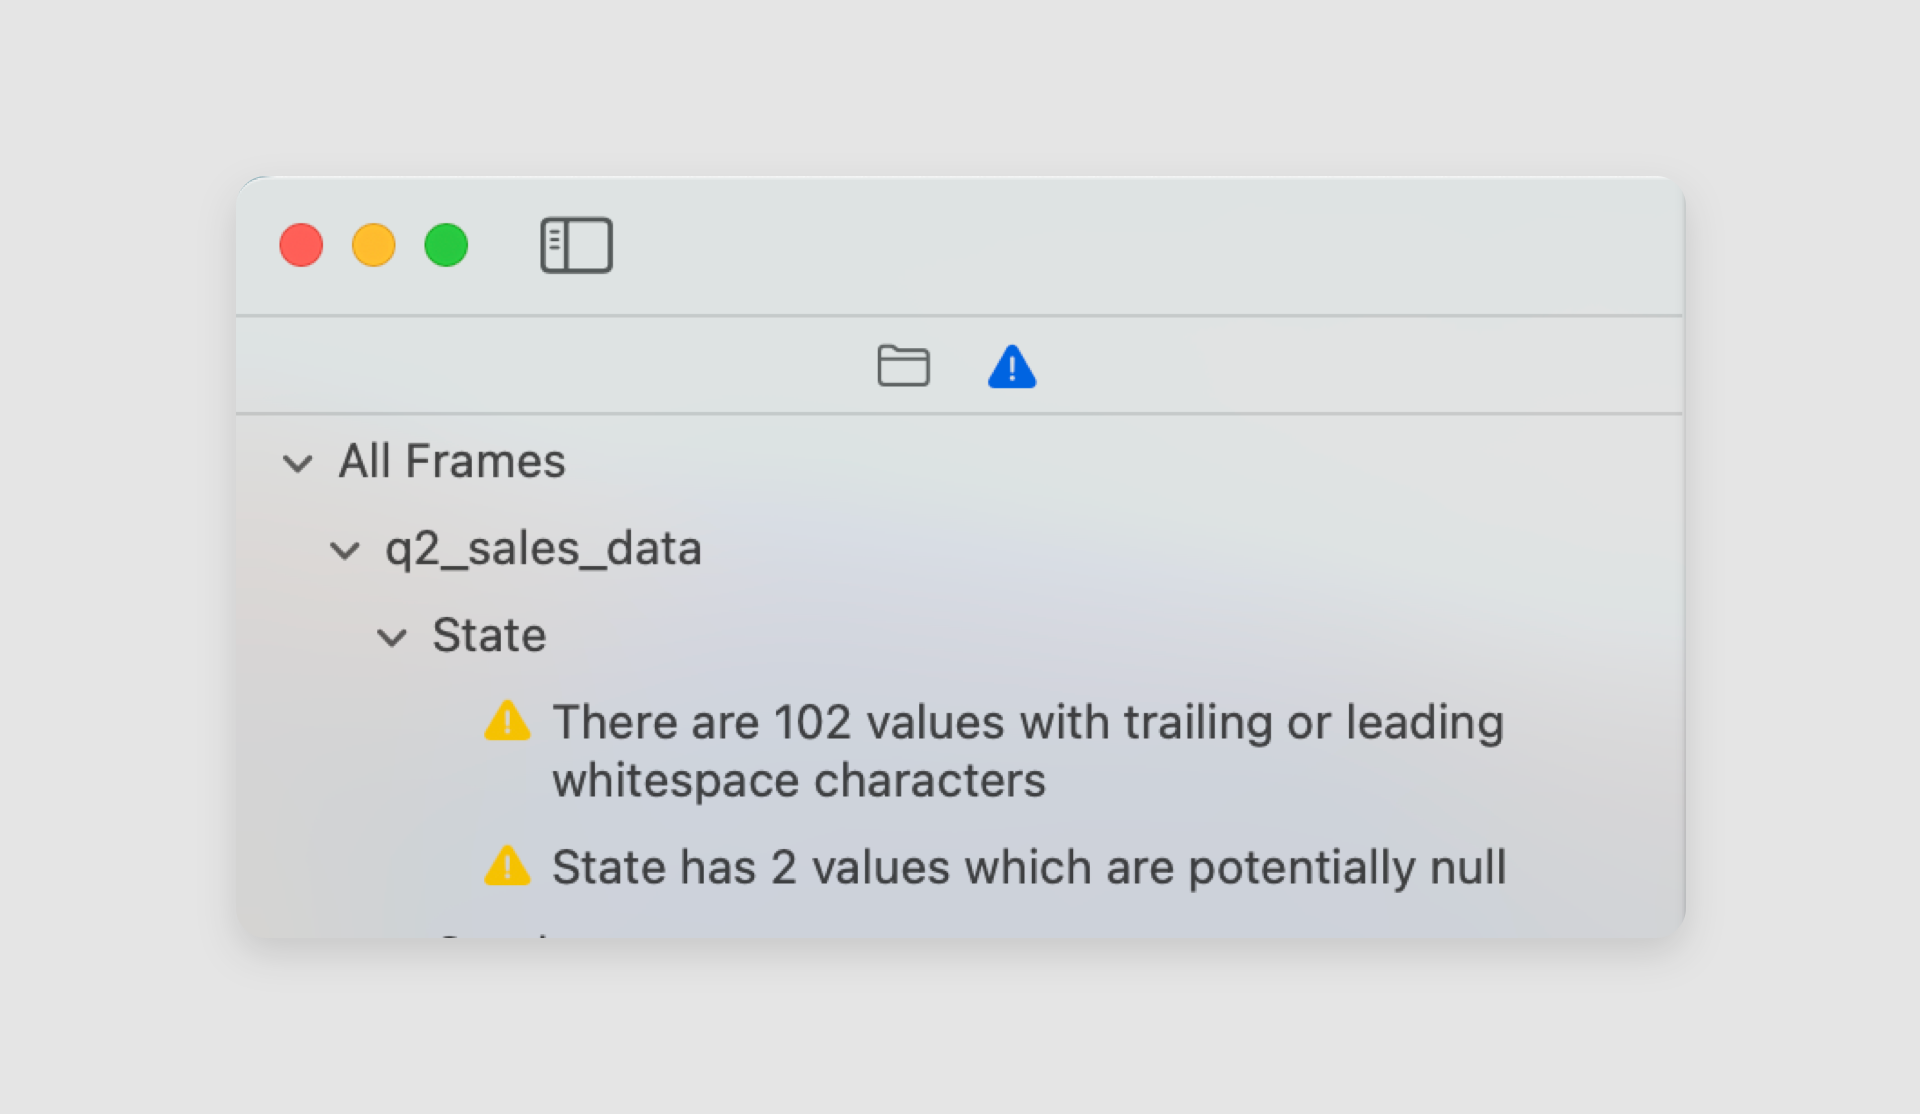
Coco automatically profiles every column and surfaces common data quality issues — nulls, mixed types, duplicates, outliers, and more — the moment you open a dataset. Warnings appear right next to the data, and each comes with a suggested fix. No writing checks by hand, no guessing where the problem is.
Edit visually, or via SQL
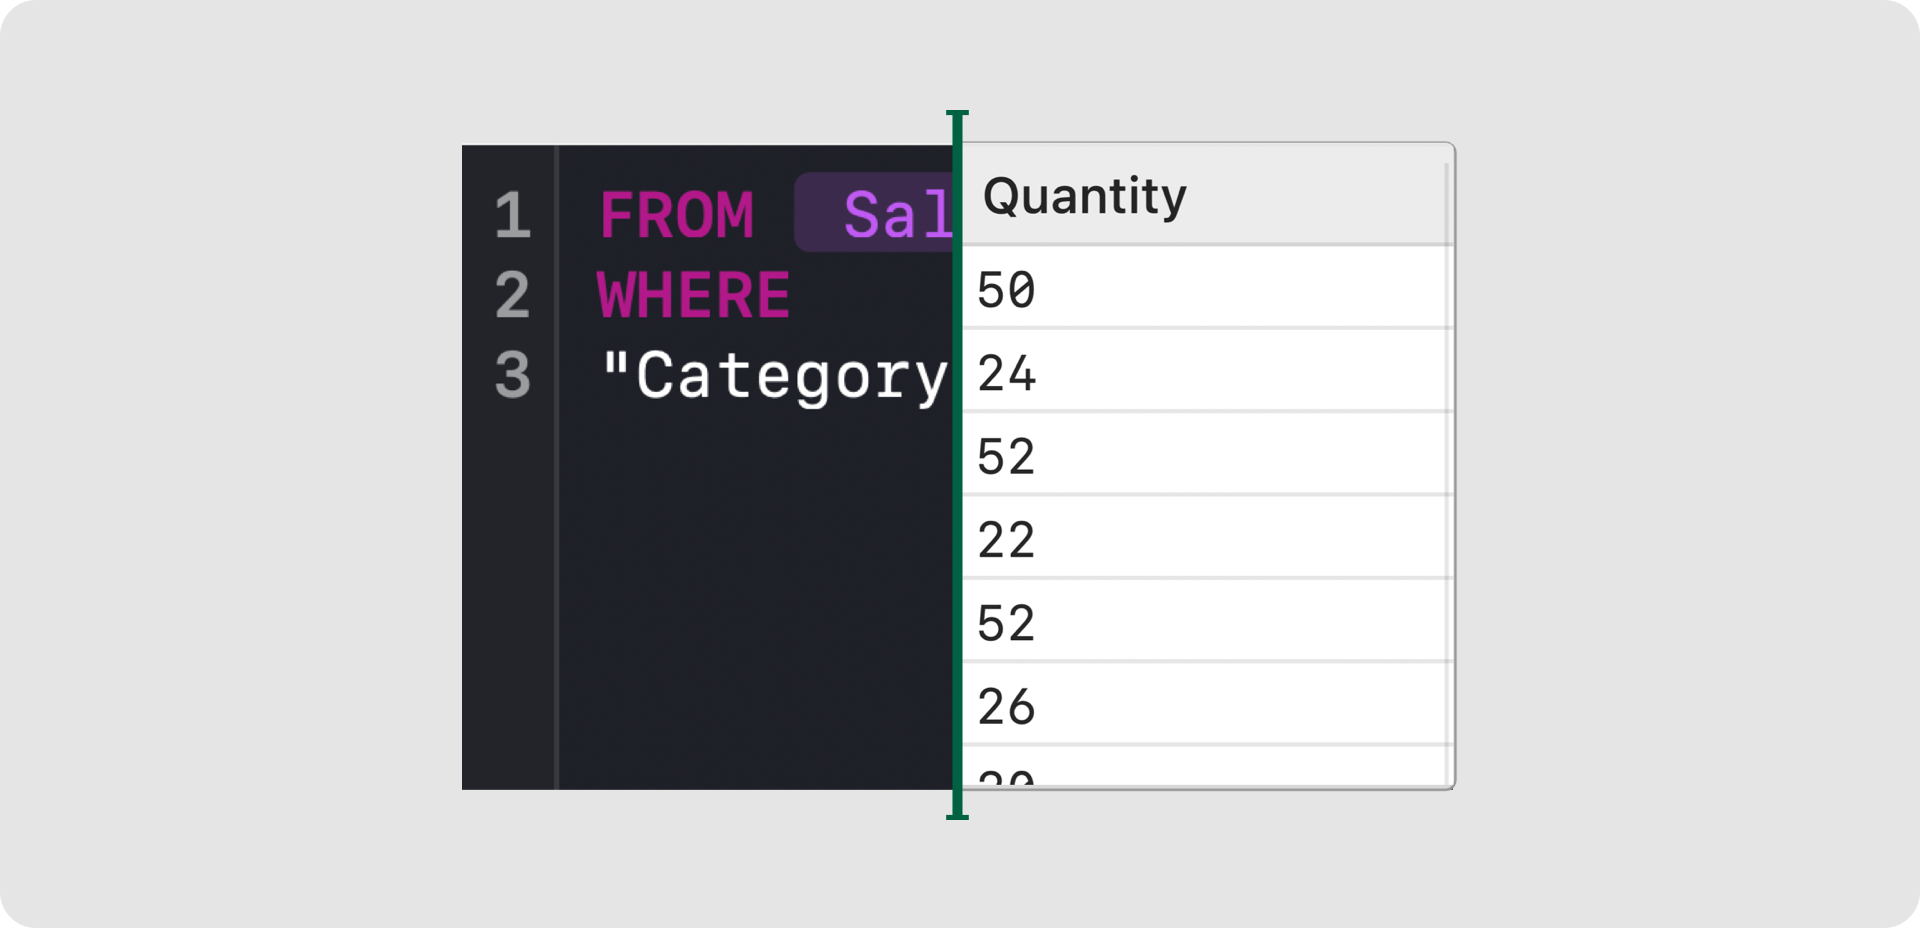
You’re able to edit your data in whatever way feels natural: click and drag to rename or reorder columns, type directly into cells like Excel, or write a query. Every change is real-time and nondestructive, so your original source is never touched and there’s no “cell execution” to wait on.
Exploration
Once your data is clean, you want to understand it. In Python that means writing df.describe(), a stack of value_counts() calls, and plotting histograms one column at a time — each one a manual round-trip. Legacy tools make you build a chart just to answer a single question, then throw it away.
Coco turns exploration into something continuous and interactive.
Profiles that update automatically
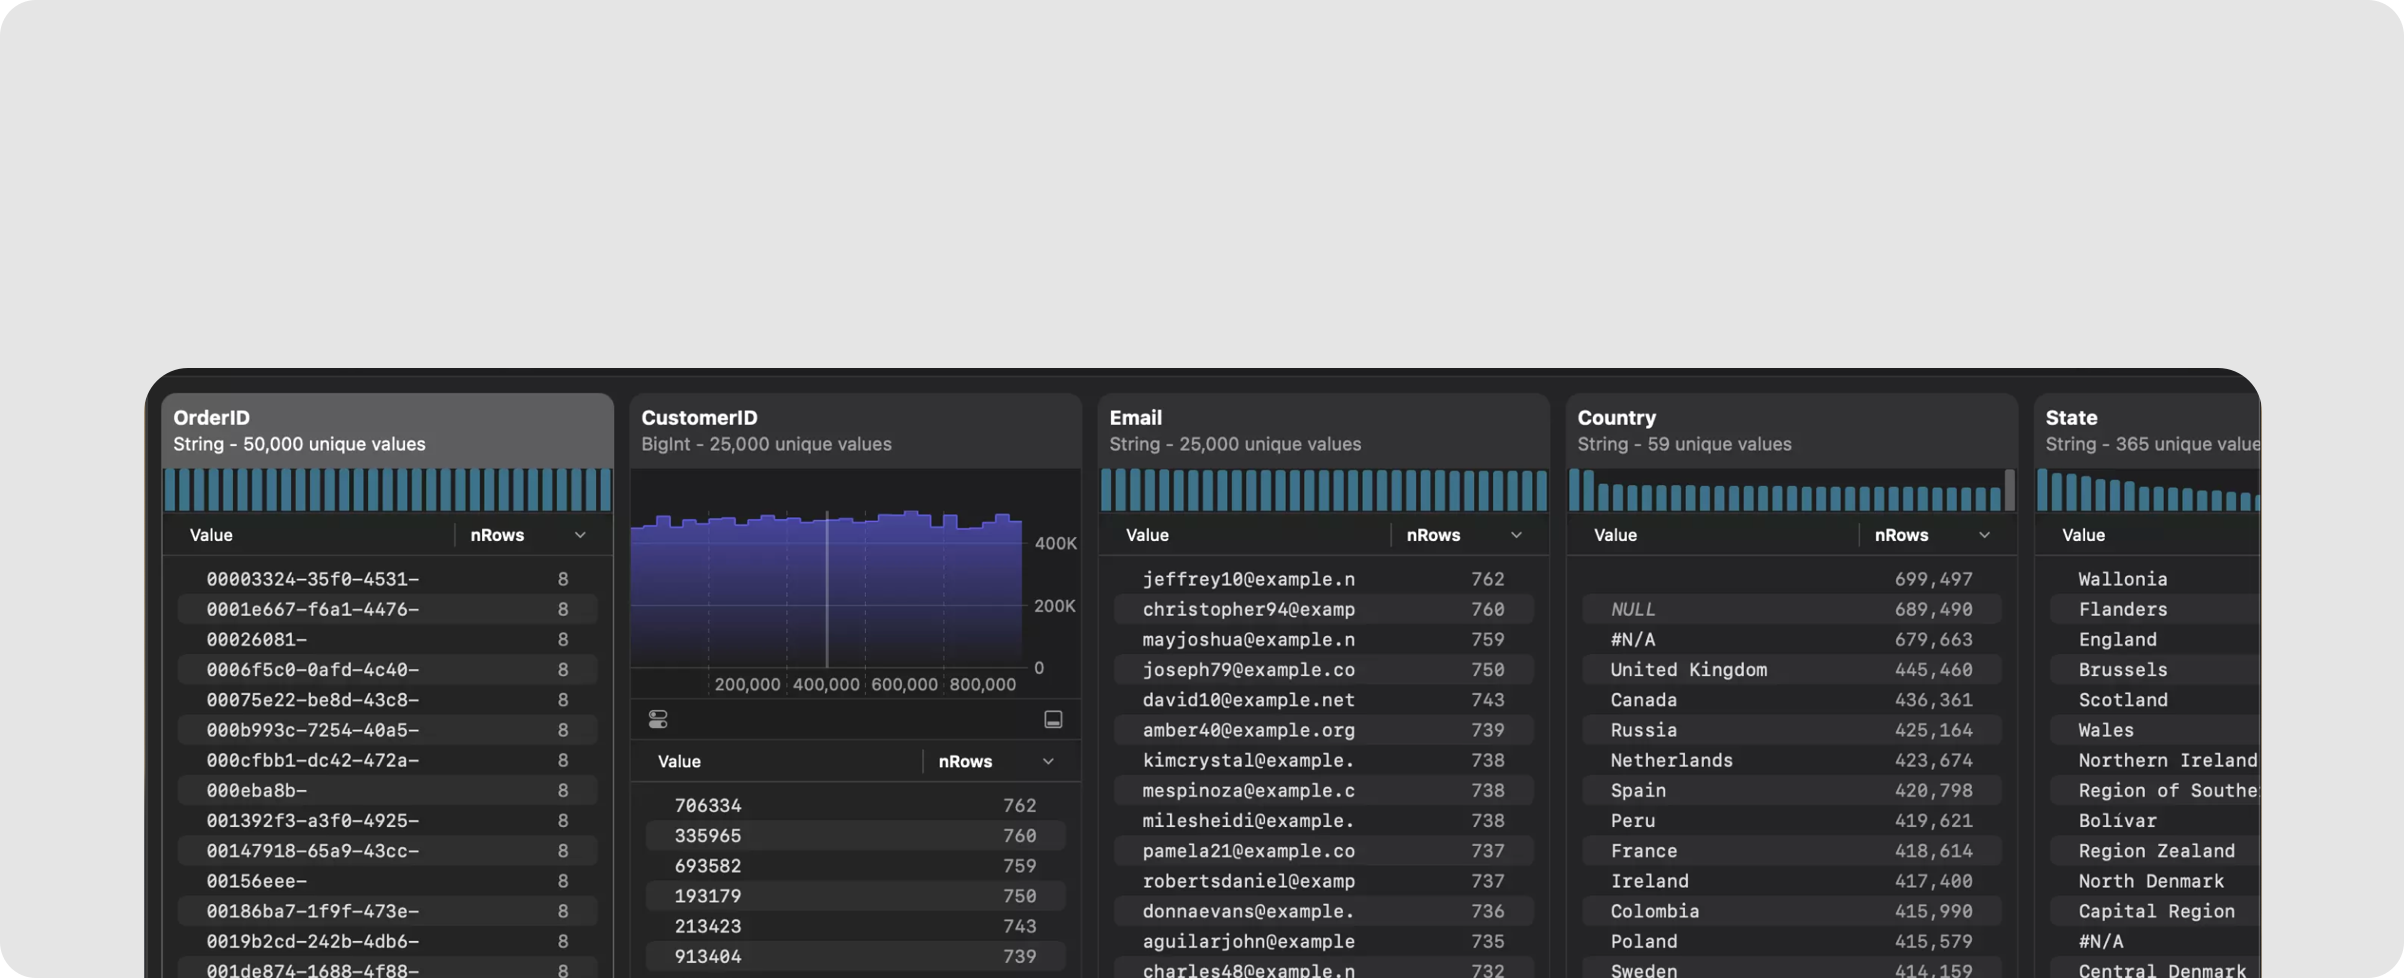
Distributions, summary statistics, and value counts are computed for you automatically, and re-compute every time you make a change. Many of the most important discoveries happen without you asking for them.
Query with CocoSQL
Coco is the first true hybrid interface for data: combine visual changes with SQL queries, with zero compromises. CocoSQL is one dialect that runs against local files, Amazon Athena, BigQuery, ClickHouse, Snowflake, or MotherDuck — without rewriting your queries. It translates functions, types, null handling and more into the underlying system, with full predicate pushdown so the same query stays fast whether it’s a local CSV or a warehouse with billions of rows.
Visualization
Turning data into a chart usually means either fighting matplotlib boilerplate or exporting everything into a separate BI tool. Both make iteration slow, and the result is static the moment you create it.
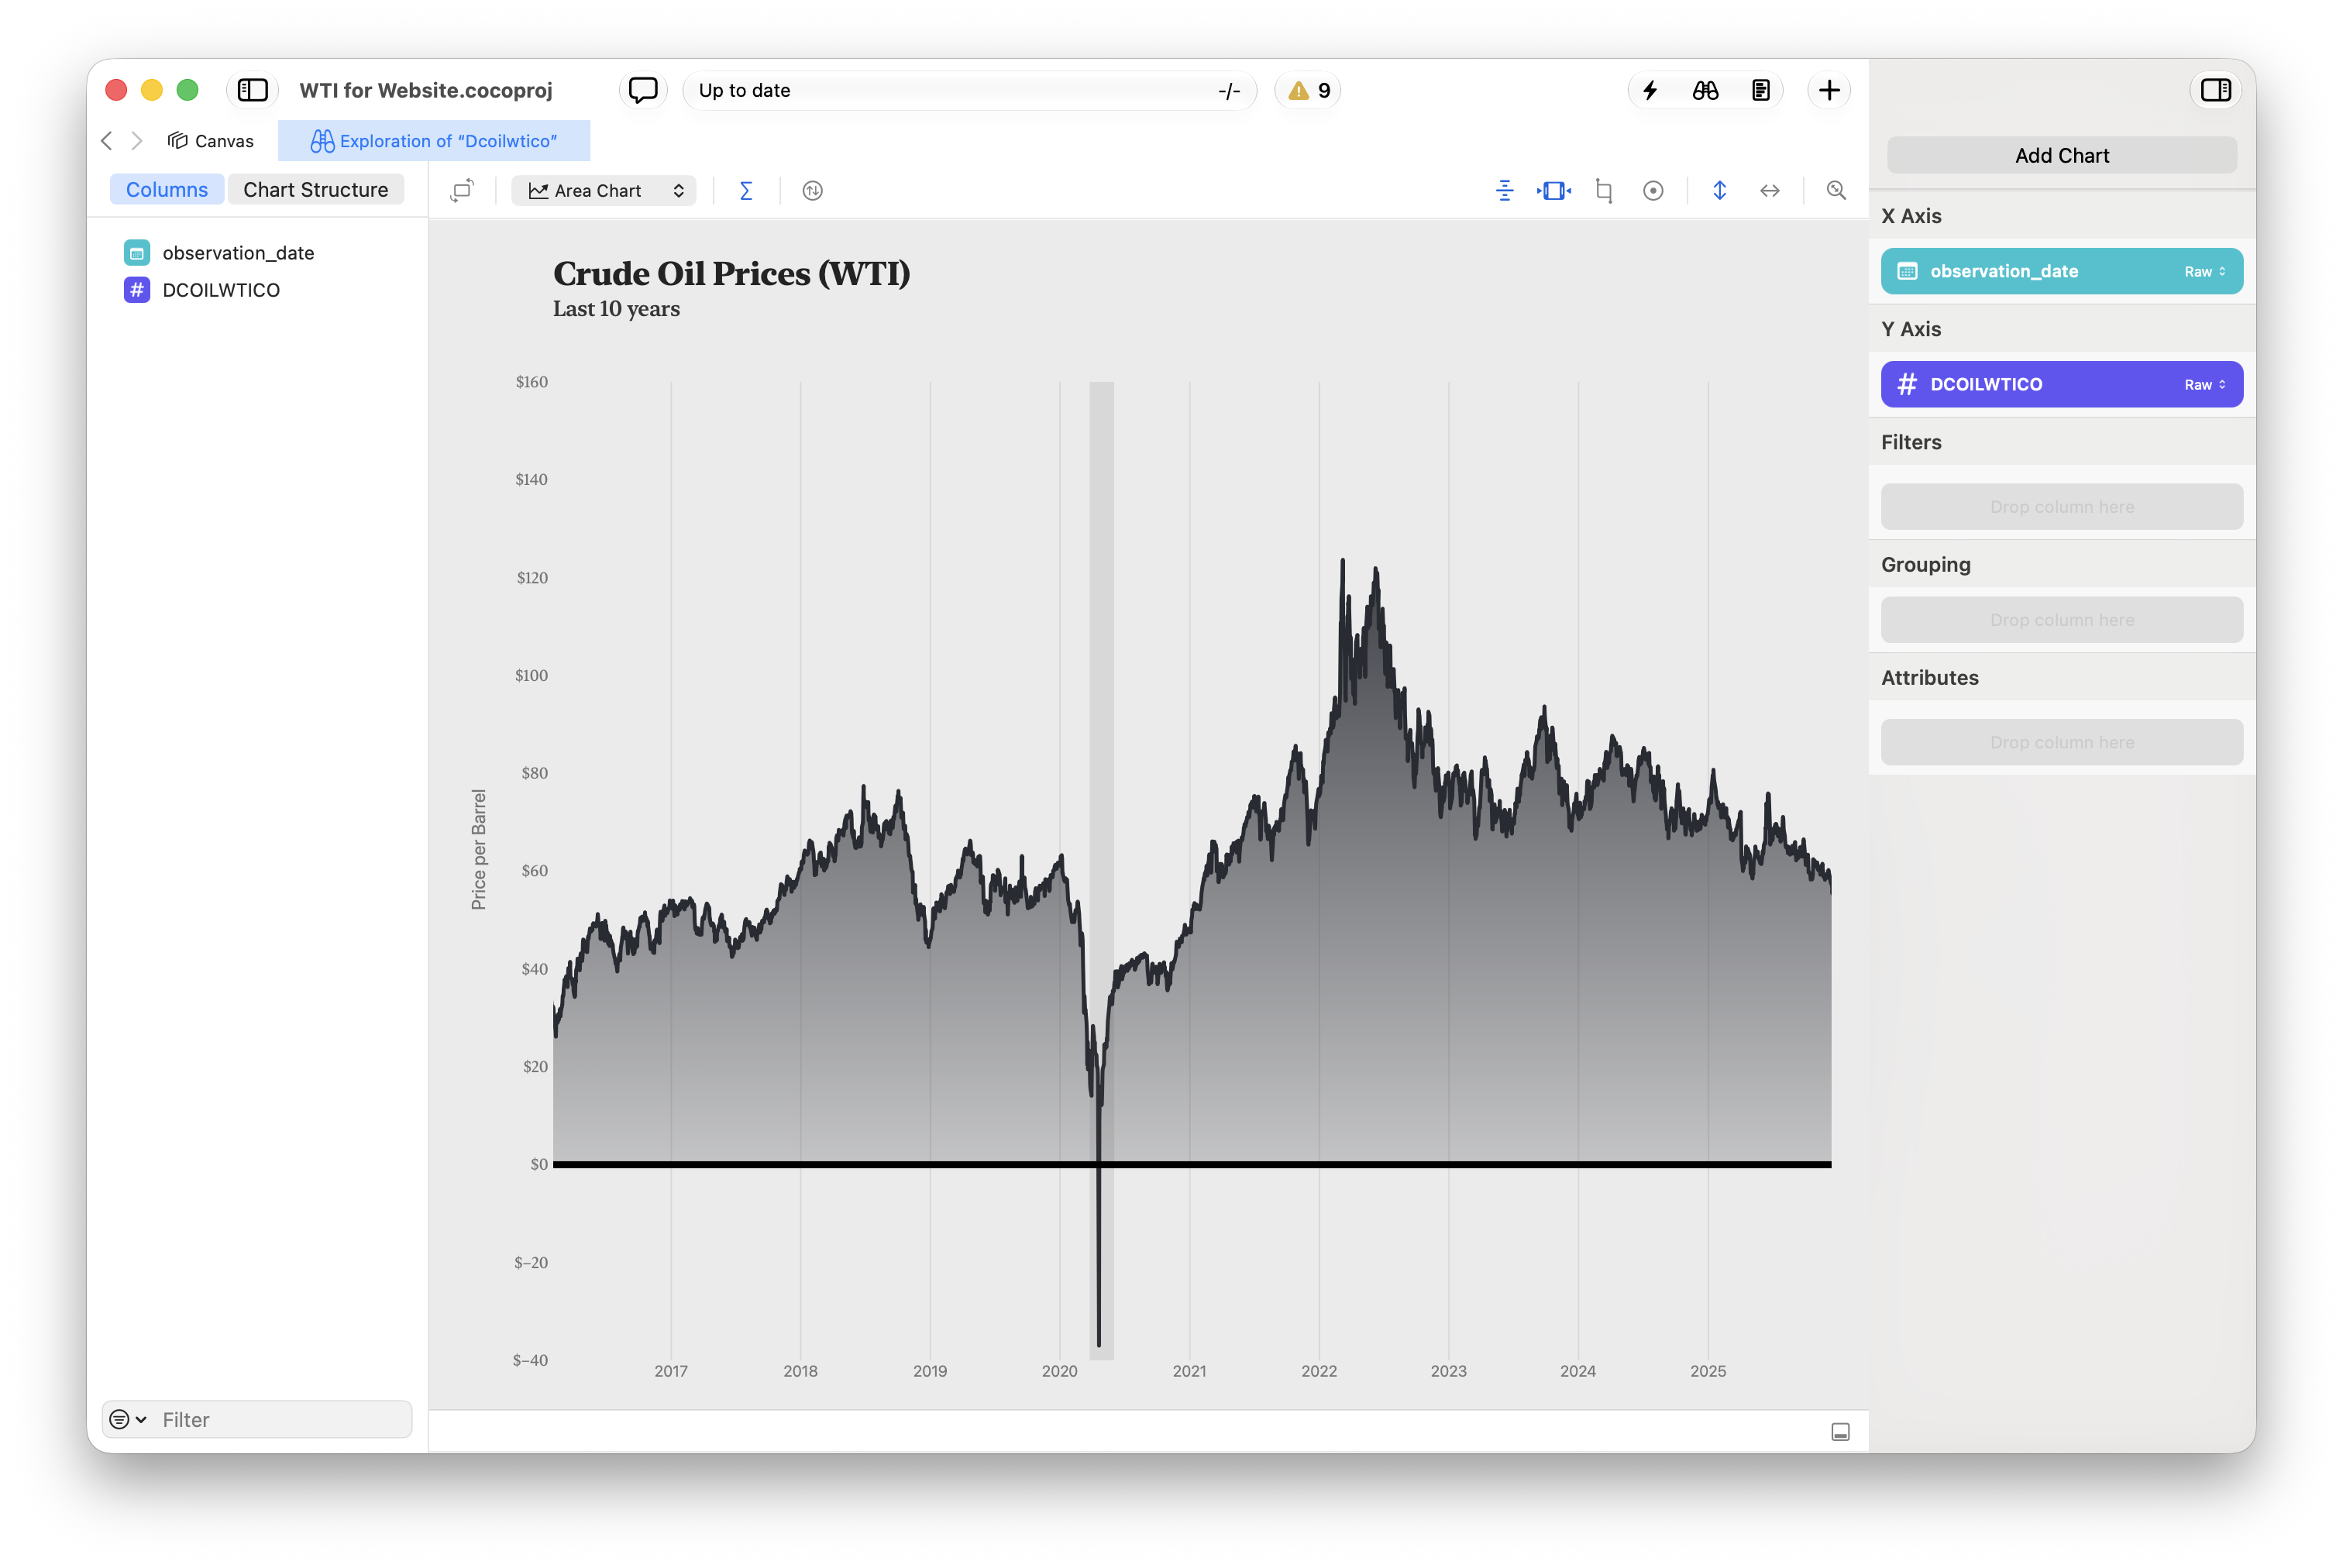
In Coco, charts are interactive and live. Build a graph in a click, drop it onto an infinite canvas alongside your data, and watch it update automatically as your underlying frame changes.
Customizable charts
Almost every property in a chart is customizable. From the interactions, to the colors, fonts, spacing, etc. Items are directly selectable, and update their properties in real time. No more limited templates, or hand-coding whole charts.
Try it out
Download Coco Alemana and give it a try.