Version 0.4.0
Coco Alemana releases version 0.4.0, with native support for interactive, column-level profiling charts.
You can download the newest version here
Visualizing the distribution of different columns in your dataset is a crucial step in any data analysis. Traditional programming environments make this process manual, and largely static.
We’ve provided an automatic, constantly updating view of your data’s distribution. Coco Alemana also allows you to manipulate the distribution to merge, remove or keep particular subsets.
This requires zero code from you, and works on any data - including remote sources like Athena and BigQuery.
Viewing the Charts
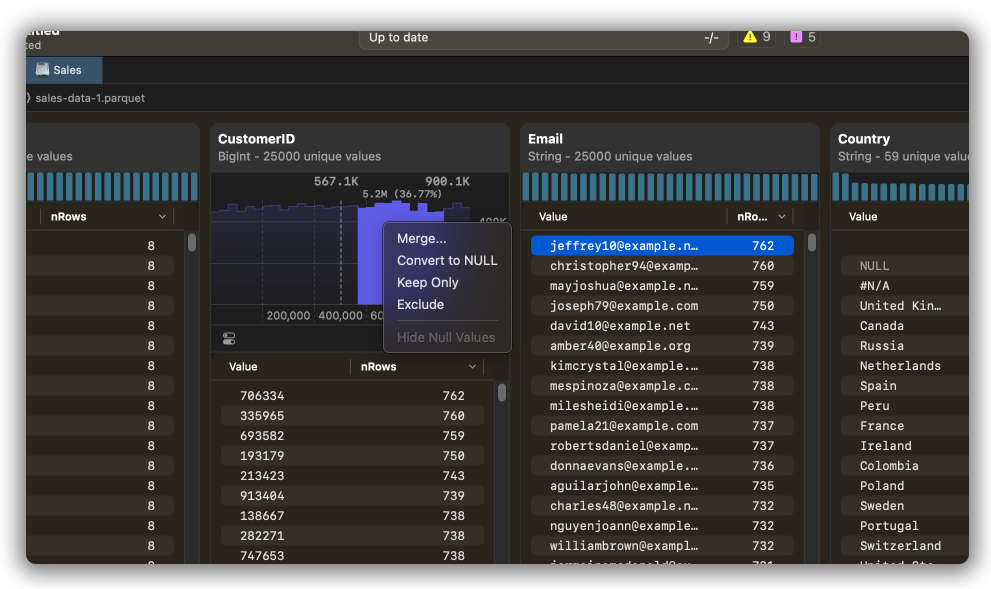
In order to access these charts, you can navigate to the distributions view of any frame. Click on any graph to expand it. You can start interacting with the graph instantly.
Interactivity
Continuous value types have the most interactivity. They contain bins which span from the smallest value to the largest, usually with a bin count of around 30.
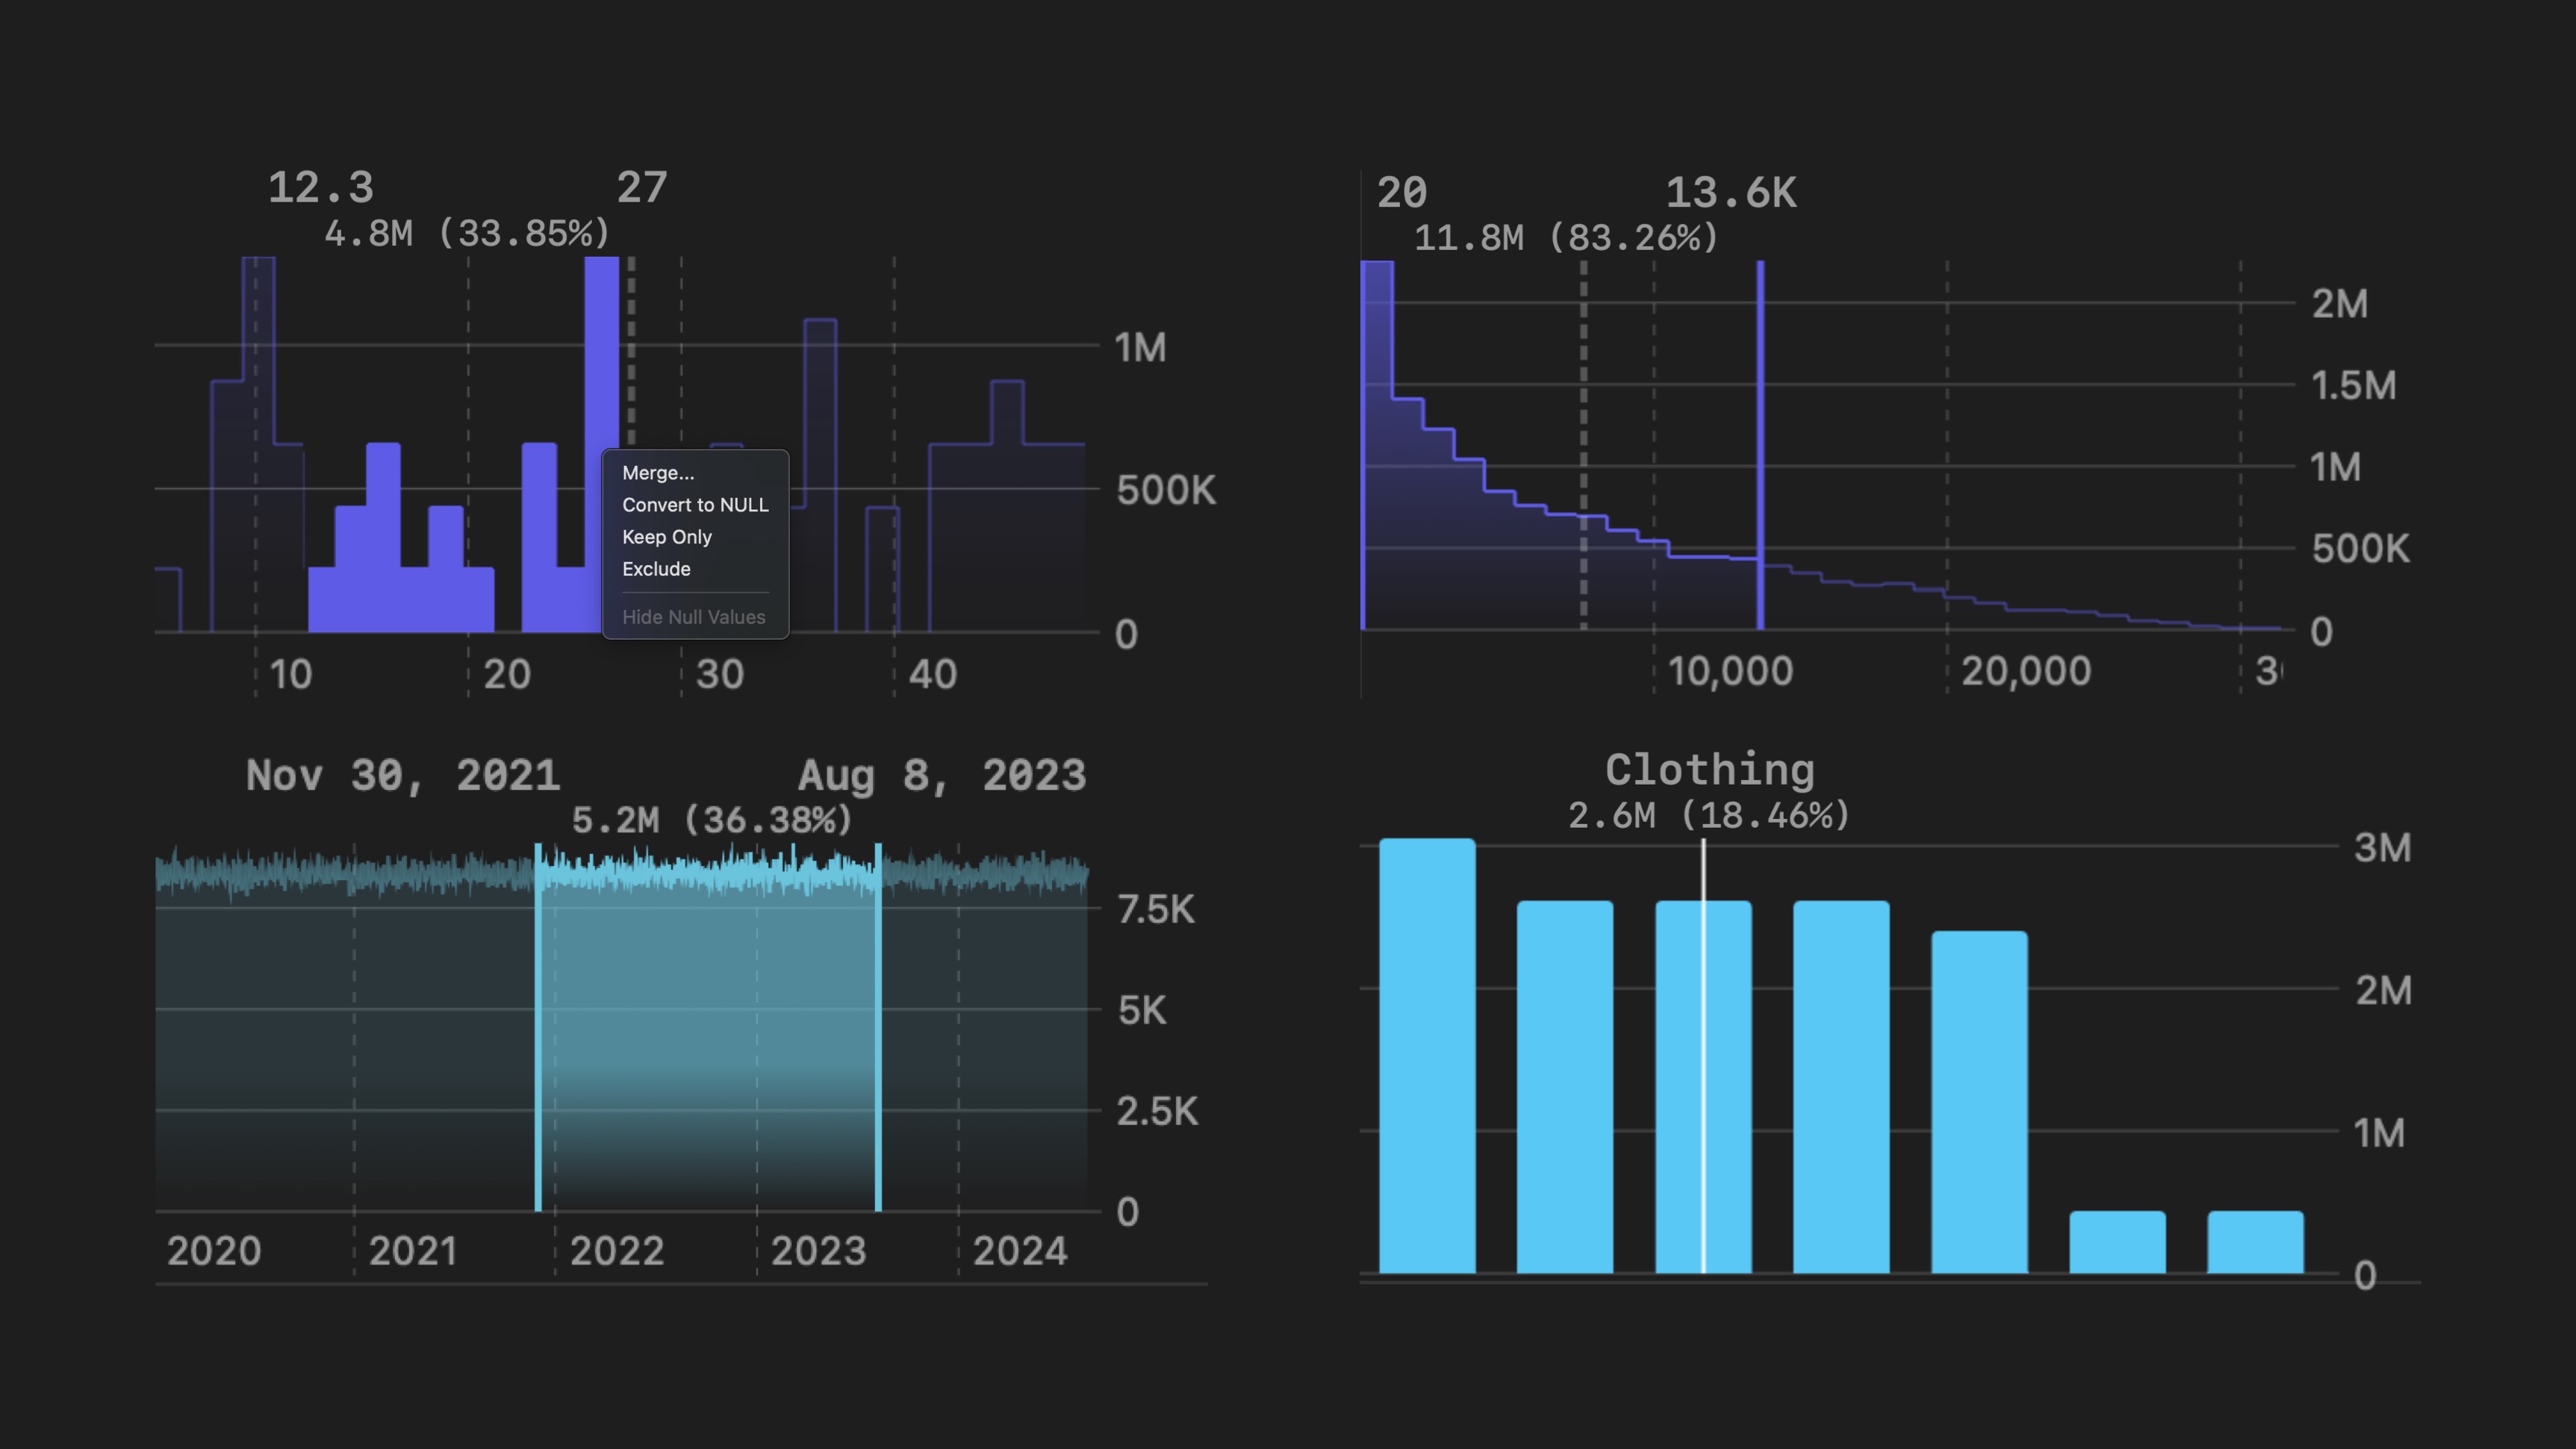
Continuous value charts, as well as date/time charts, support range selection. You can select a range, and right click to see a set of options, where you can “Merge”, “Convert to NULL”, “Exclude” or “Keep Only”. Keep Only or Exclude are equivalent to applying a filter to the entire frame.
Statistics
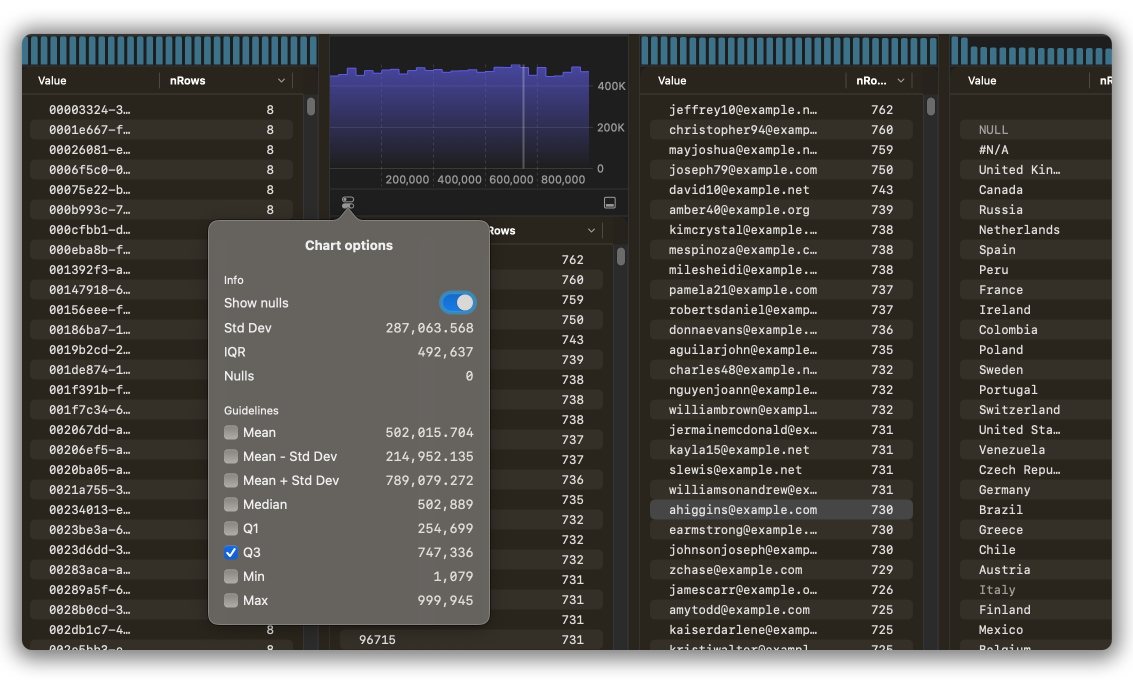
By default, we generate useful statistical information each time the chart updates. You can access these values by hitting the control button on the bottom left of the chart. Values are copyable by clicking the copy icon to the left of the numerical value.
Guide Lines
We provide statistical value guide lines to help you more precisely drag ranges. You can drag from the Average to Q3, to Max, or another bin offset of your choosing. If you’re using a track pad, it clicks, too!
You can toggle guide lines per chart in the chart options panel.
Other Chart Types
We also support charts for String (categorical) and Boolean values. These have significantly less interactivity.
Limitations
Statistical Approximates
Certain statistical calculations are approximates. This is due to the computational complexity involved in calculating percentiles. The list of statistics which are approximate are as follows:
- Q1
- Median
- Q3
- IQR (based on approx. Q1 and Q3)
- Range based selections “snapped” to guide lines will show approximate row counts.
Bin Sizing
We currently do not support custom number of bins, or specifying a bin width. The normal amount is around 30, and may be less if the number of unique values is less than 30. This may change in the future.
Date Precision
The maximum granularity we support for dates & timestamps is “hour”-level precision. This is likely to change in the future for more granular types. The standalone TIME type is not supported.
Strings
String columns are provided with a maximum of 30 values. This is not changeable. For best results with strings, continue to use the value counts list below the chart.
Bug Fixes in this Release
While most of our changes here are new features, we did fix several bugs along the way.
- Reduces load times for frames
- Fixes issues with cache-related issues
- Fixes login issues
- Resolves certain pre-fetch inaccuracies.
- Adds
approx_quantilefunction into CocoSQL